


Website KPIs That Actually Matter to CMOs (Beyond Traffic)

You've just finished your quarterly business review. The head of sales mentions a concerning trend: your website's traffic is up 47% year-over-year. Your finance partner nods approvingly. But then the CFO asks one question: "How much pipeline did that traffic actually generate?"
Silence.
This is the real state of B2B website measurement. Most CMOs obsess over metrics that feel productive (traffic, pageviews, bounce rates) without connecting them to the revenue they're actually responsible for leading.
The truth is brutally simple: 80% of the metrics marketing teams track tell you nothing about whether your website is actually making money. Meanwhile, the metrics that matter, the ones you should be losing sleep over, are often buried 3 layers deep in dashboards or tracked in spreadsheets that never talk to each other.
This guide exists to flip that. We're going to cut through the noise and show you exactly which website KPIs actually matter to revenue-focused CMOs, which B2B website KPIs set enterprise expectations, and how to build a measurement framework that doesn't just look sophisticated, but brings results. Over the past two years, we've rebuilt 129+ B2B websites and audited 100+ more, helping SaaS, FinTech, Venture Capital, Artificial Intelligence, and B2B tech companies revamp their sites successfully. Here's what we learned.
Why Most CMOs Are Measuring the Wrong Website KPIs
Google Analytics fires up when a visitor lands. You get traffic numbers. Page counts. Bounce rates. Engagement metrics. Your marketing automation platform logs form submissions. You celebrate the MQLs.
But the chains connecting these dots to revenue are invisible. You can't see them in standard dashboards. And without them, you're flying blind.
B2B website KPIs to track should answer one specific question: Is this website moving deals closer to closing? Not "Is the website popular?" Not "Are visitors clicking around?" The singular test is revenue velocity.
The 3-Layer Framework: Why Most B2B Website KPIs Miss the Mark
As Ayush Barnwal, CoFounder, ThunderClap, likes to put it:
“Most B2B websites don’t fail because of bad design or weak copy. They fail because CMOs obsess over traffic, clicks, and vanity engagement while ignoring the few KPIs that actually move the pipeline. Until you fix what you measure, no redesign will fix your revenue.”
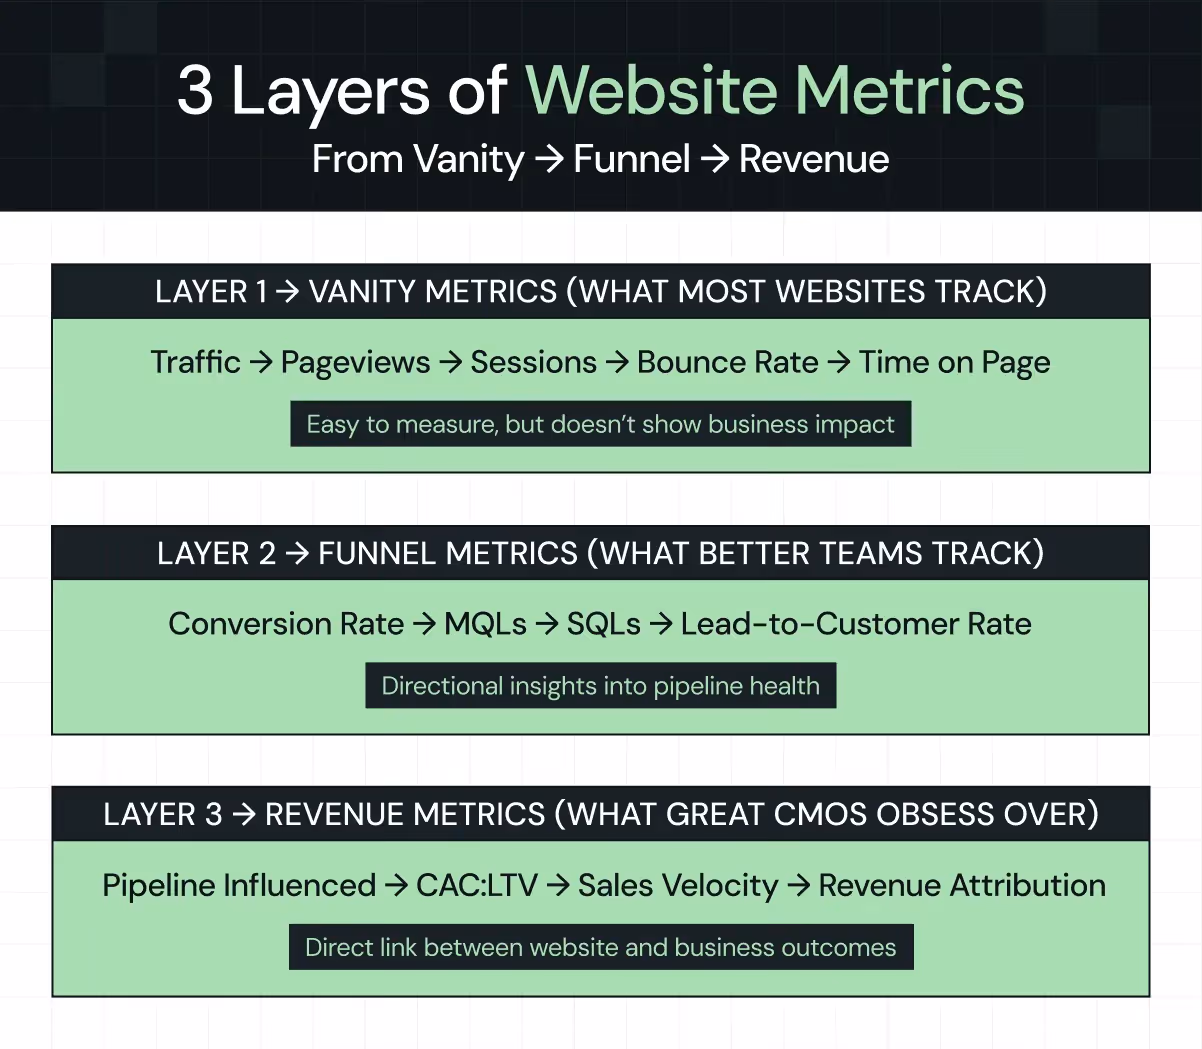
Layer 1: Vanity Metrics
Traffic. Pageviews. Sessions. Bounce rate. Time on page. These are the numbers that appear in weekly status reports and make marketing leaders feel productive. However, these are not as useful.
Here's why: 100,000 visitors tell you nothing about whether any of them will ever become customers. A bouncing visitor might be a satisfied customer who found exactly what they needed on one page. A high bounce rate on educational content is often a sign you're doing great B2B marketing; you answered the question so well, visitors didn't need to explore further.
Yet most CMOs measure these relentlessly and adjust strategy around them.
Layer 2: Funnel Metrics
Conversion rates. MQLs. SQLs. Lead-to-customer conversion. These metrics live in the territory between visits and revenue. They're directionally useful; if your MQL-to-SQL conversion rate drops, something in your qualification, messaging, or lead quality is broken.
But they still don't tell the complete story. An MQL tells you someone raised their hand. It doesn't tell you if they'll ever become profitable, if they're in your ICP, or if they're genuinely interested. You need to go deeper.
Layer 3: Revenue Metrics
Pipeline influenced by the website. CAC: LTV ratio. Lead-to-customer conversion. Sales cycle velocity. Revenue attribution. These are the metrics that connect website performance to board-level outcomes.
This is where grown-up CMOs live.
{{specficBlog}}
The Most Important Website KPIs for B2B CMOs in 2025
Let's get specific. These are the most important website KPIs that CMOs at enterprise-scale B2B companies should track as their primary north-star metrics.
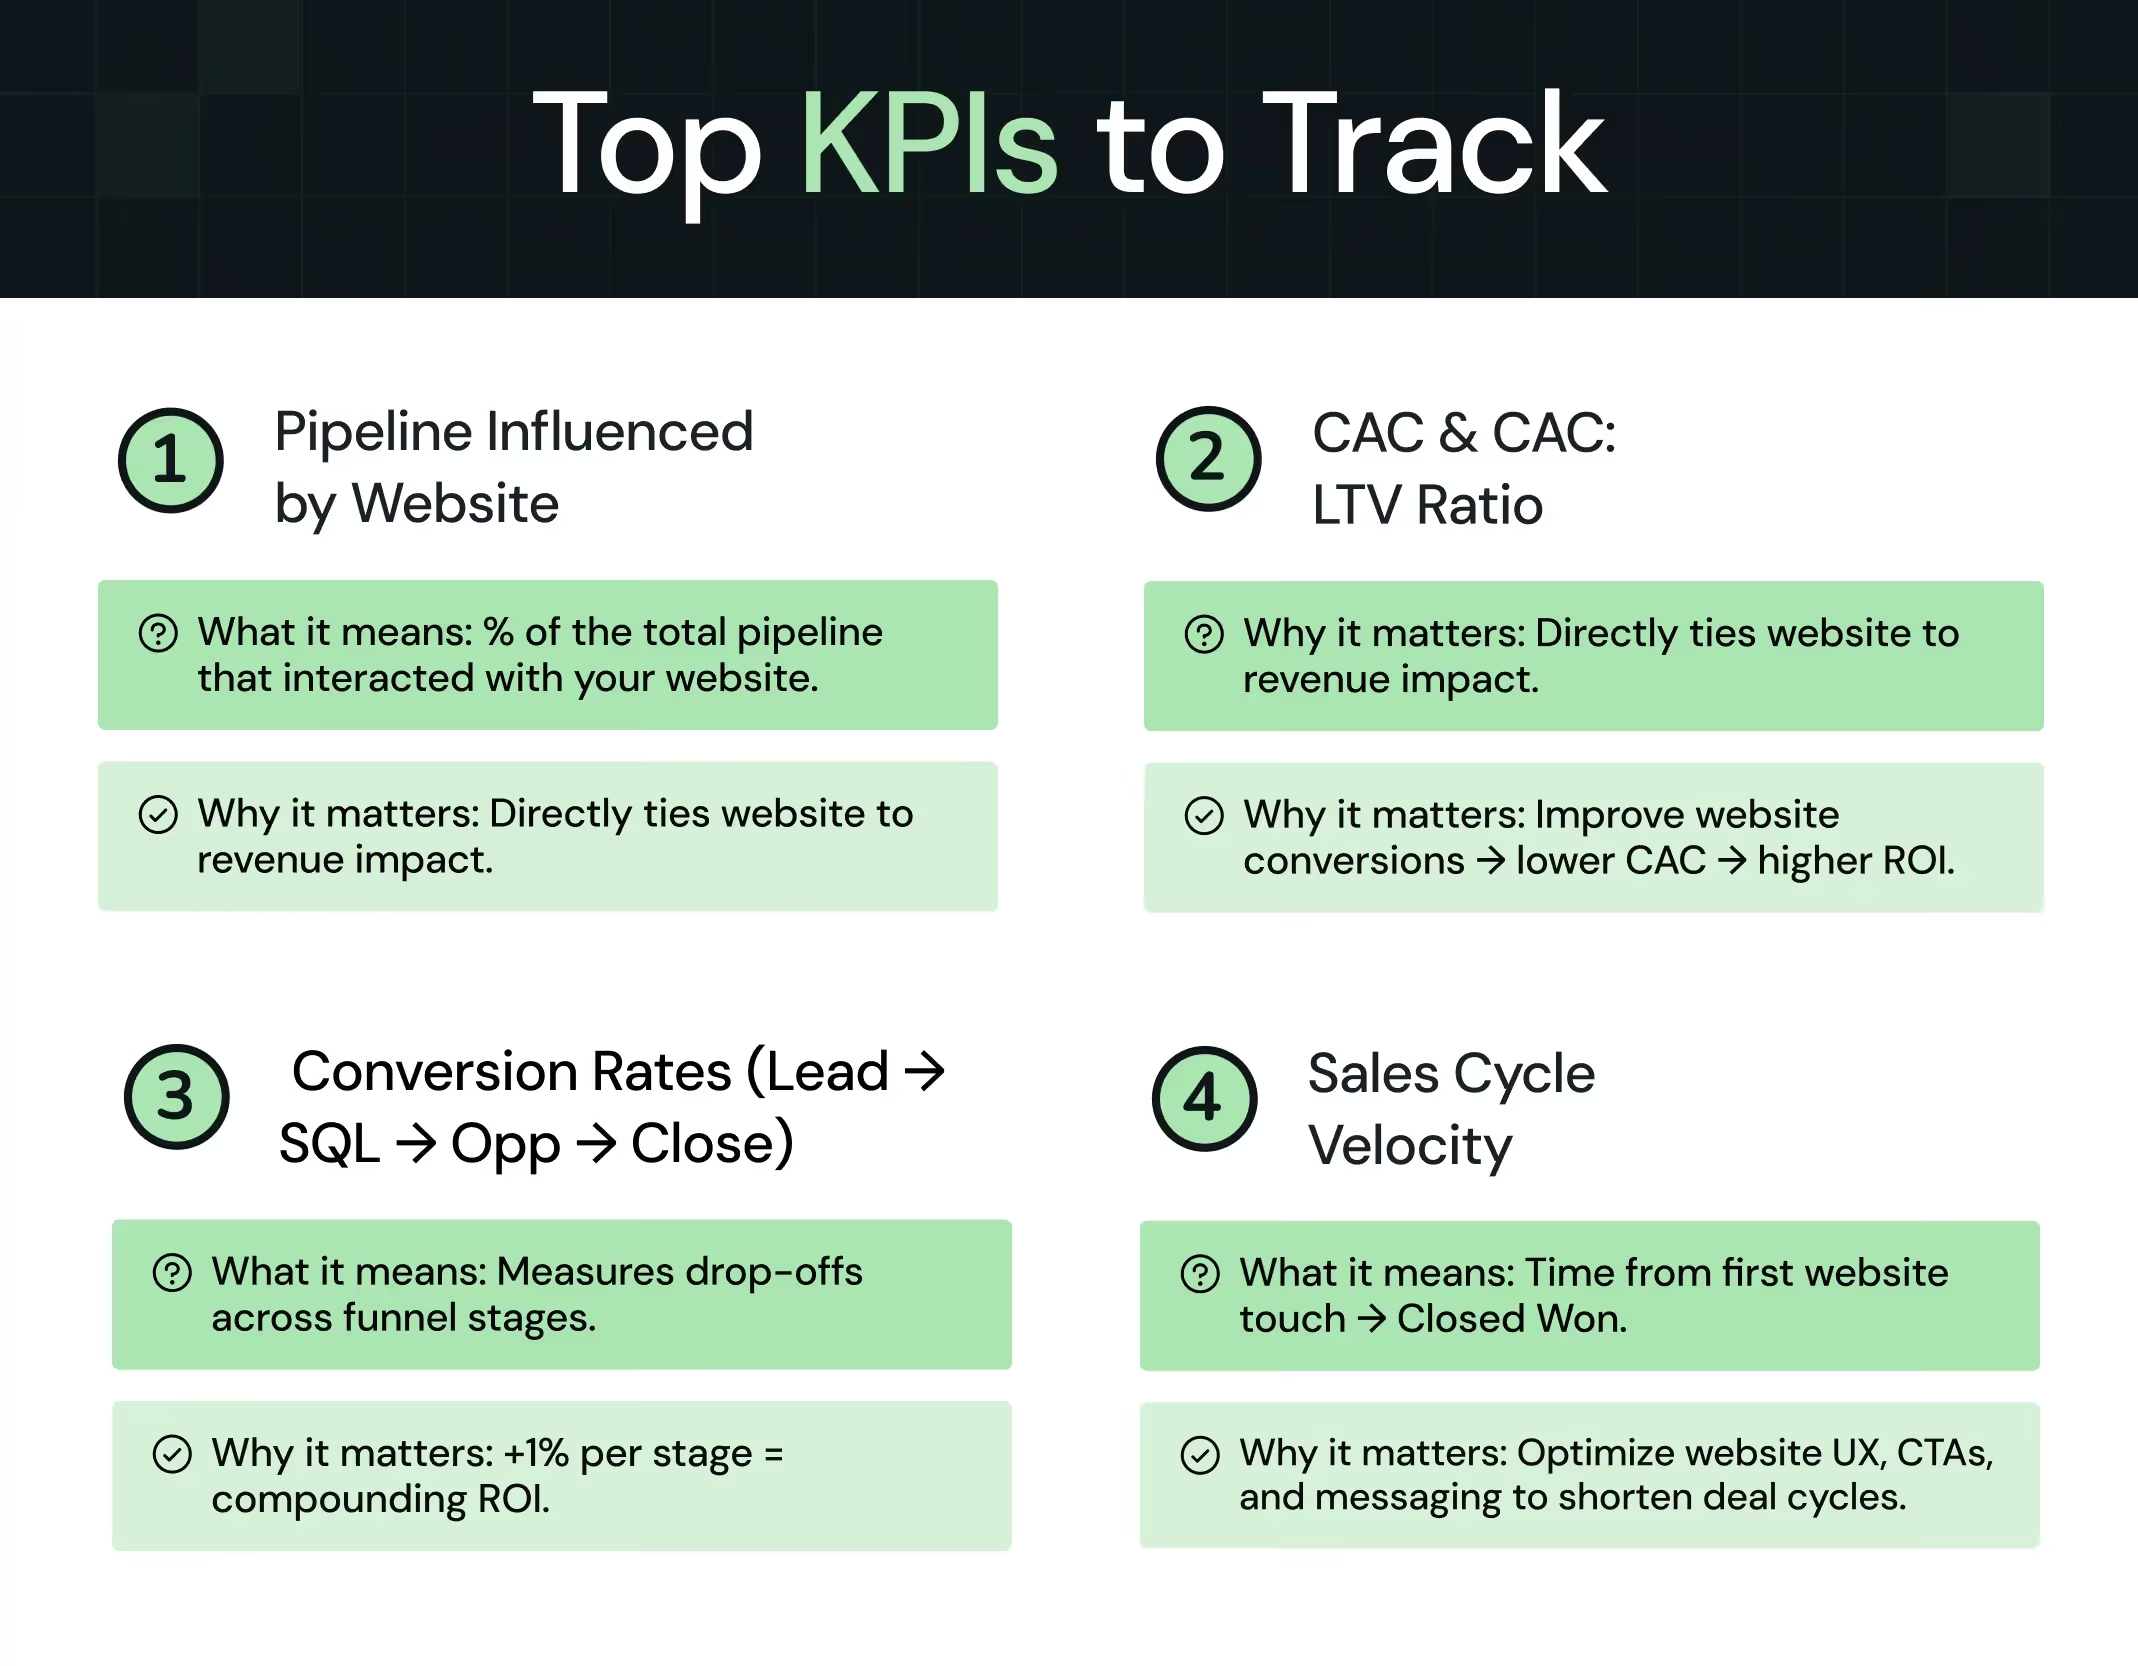
1. Pipeline Influenced by Website
Definition: The total value of open pipeline that has touched your website at any point in their customer journey, directly or through influenced touches.
Why it matters: This single metric connects your entire website to revenue. It answers the question: "How much revenue did my website contribute to?" Not just as direct conversions, but as a trusted resource that buyers touched as they researched your solution.
How to measure it:
Multi-touch attribution tools (Ruler Analytics, DreamData, 6sense, Marketo) assign credit to marketing touchpoints across the buyer journey. You can track:
- Sourced pipeline: Leads whose first tracked touchpoint was your website
- Influenced pipeline: Any deal that touched your website at any stage, even if sales sourced them
Benchmark: B2B companies should aim for the website to influence 30-50% of the total pipeline, depending on sales efforts and channel mix. High-velocity companies see 60%+ of the pipeline influenced by website activity.
Current Reality: With B2B buyers completing their research before talking to sales, your website should be influencing significantly more pipeline than it is generating directly. If your website touches only 10-15% of the pipeline, you have a massive untapped opportunity.
2. Customer Acquisition Cost (CAC) and CAC: LTV Ratio
Definition: Total sales and marketing spend divided by the number of customers acquired, and then contextualized against the lifetime value those customers generate.
Why it matters: CAC tells you the efficiency of your go-to-market engine. CAC: LTV ratio tells you if your website investment is creating profitable growth or expensive noise.
How to measure it:
CAC = Total Marketing + Sales Spend ÷ Number of New Customers
For websites specifically:
Website CAC = (Website-attributed spend) ÷ (Customers acquired via website)
But raw CAC matters less than the ratio:
Healthy CAC: LTV ratios by industry
- SaaS (general): 3:1 to 5:1 (meaning for every $1 spent acquiring, you should earn $3-$5 across customer lifetime)
- Enterprise SaaS: 4:1 to 7:1 (higher complexity, longer sales cycles justify higher CAC)
- B2B Services: 3:1 (tighter margins require efficiency)
- Fintech: 5:1 to 7:1 (high customer value justifies higher acquisition cost)
Current Reality:Average B2B CAC sits around $536, but this hides massive variance. High-performance companies optimizing their websites through conversion rate optimization (CRO) report 20-40% improvements in efficiency year-over-year.
3. Conversion Rate: Lead → SQL → Opportunity → Customer
Definition: The stage-by-stage conversion rates showing what percentage of visitors become leads, what percentage of leads become sales-qualified leads, and so on through close.
Why it matters: Every percentage point lost at each stage represents revenue leakage. A 1% improvement at each stage compounds dramatically across the entire funnel.
Stage-by-stage benchmarks:
The cascade effect: If you have 10,000 monthly website visitors:
- At 2.5% (median) conversion to lead = 250 leads
- At 15% MQL-to-SQL = 37 SQLs
- At 11% SQL-to-opportunity = 4 opportunities
- At 7% close rate = 0.3 customers
Compare this to a high-performance company optimizing each stage:
- At 4% conversion to lead = 400 leads
- At 22% MQL-to-SQL = 88 SQLs
- At 18% SQL-to-opportunity = 16 opportunities
- At 12% close rate = 1.9 customers
Same traffic. 6x the revenue.
Current Reality: Most B2B websites operate in the bottom quartile. But companies investing in strategic website redesigns, copy optimization, and CRO see conversion lifts.
4. Sales Cycle Velocity
Definition: Average time from first website touch to closed-won deal, and the rate at which deals progress through each stage (MQL → SQL → close).
Why it matters: Time is money in B2B sales. A 30-day improvement in sales cycle length means you close deals faster, recoup CAC sooner, and free up sales capacity for new business. At scale, this compounds into millions.
How to measure it:
- Average sales cycle length: Days from SQL to close
- Deal aging: Days in any single stage without movement (red flag: any stage exceeding 30 days)
- Stage velocity: Days to progress MQL → SQL → Opportunity → Close
- Time-to-first-conversation: Days from lead submission to first sales call (should be <4 hours for optimal conversion)
Current Reality: Pipeline velocity is the metric most B2B leaders ignore and most regret.
Your website affects this directly. Fast load times, clear value proposition, reduced form friction, and compelling CTAs all shorten the time from visitor to sales-ready lead.
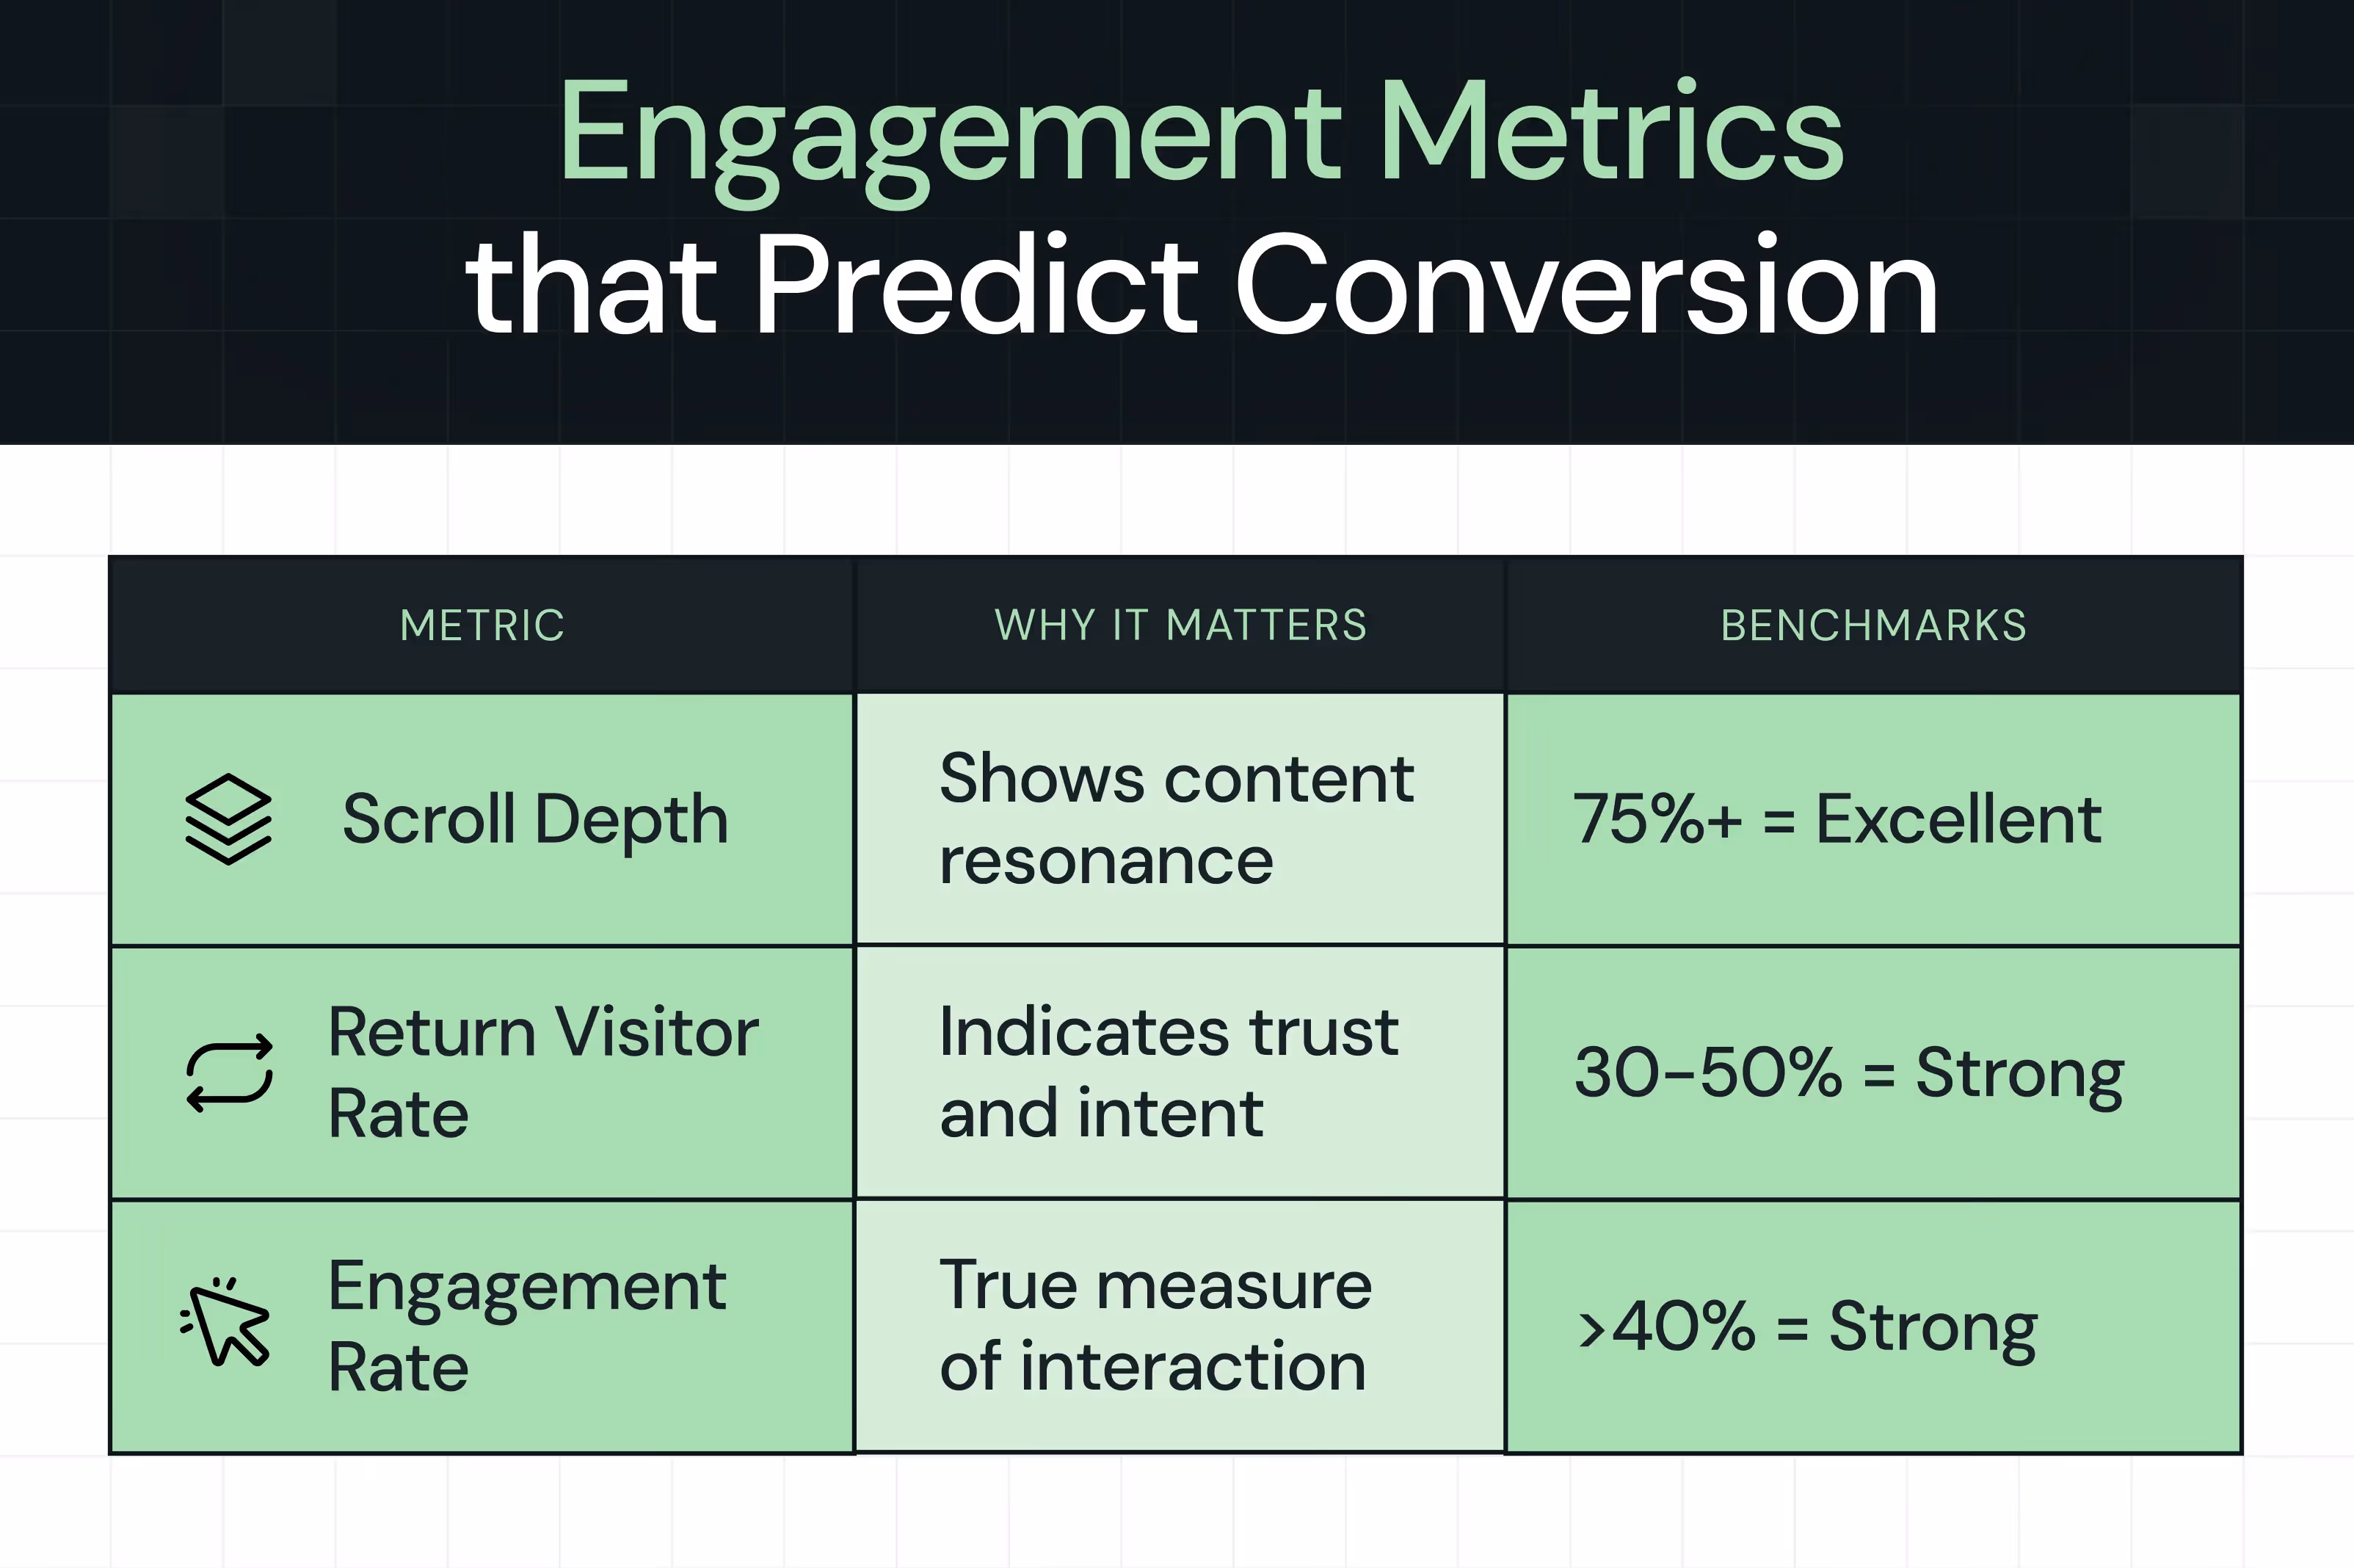
The Engagement Metrics That Predict Conversion
Beyond the revenue metrics, there are engagement-quality signals that predict whether someone will eventually convert.
1. Scroll Depth
What it measures: How far down a webpage a visitor scrolls, typically expressed as a percentage (e.g., 45% scroll depth = visitors scroll through ~45% of the page on average).
Why it matters: Users who scroll deeper into your content are more engaged. They're reading past the headline, considering your value proposition, and consuming proof. These visitors convert at 2-3x higher rates than those who scroll minimally.
Benchmark: On key commercial pages (pricing, product overview, homepage):
- 75%+ scroll depth: Excellent engagement; indicates strong messaging and content relevance
- 50-74% scroll depth: Good; visitors are exploring
- 25-49% scroll depth: Concerning, messaging may not resonate
- <25% scroll depth: Critical; your value prop or page speed is failing
How to measure: Use Google Analytics 4 (with Google Tag Manager scroll-depth triggers) or dedicated tools like Hotjar, Lucky Orange, or VWO to track scroll events at 25%, 50%, 75%, and 100% milestones.
The tactical play: If scroll depth on your homepage hero section drops below 40%, your headline isn't compelling enough. Test new headlines, hero copy, or visual hierarchy before assuming traffic quality is the problem.
2. Return Visitor Rate
What it measures: The percentage of sessions coming from returning users (people who have visited your site at least once before).
Why it matters: Returning visitors indicate trust and sustained interest. They browse deeper, engage with more pages, and convert at higher rates than first-time visitors. For B2B websites in early-stage funnel work, return visitors are often your future sales pipeline.
Benchmark:
- 30-50% returning visitors: Healthy loyalty; indicates content is trusted
- >50% returning visitors: Excellent; strong brand pull and content resonance
- <20% returning visitors: Red flag; content isn't sticky enough to create repeat engagement
The tactical play: If your return visitor rate drops below 25%, your content isn't delivering enough value to warrant repeat visits. Either refresh stale content, add new resources, or improve your email nurture to draw visitors back.
3. Engagement Rate
What it measures: The percentage of sessions where visitors engaged meaningfully with your page (scrolled, clicked, spent >10 seconds, etc.), versus sessions where they bounced immediately.
Why it matters: Unlike bounce rate, which is often misleading, engagement rate tells you if visitors actually interacted with your content.
Benchmark:
- >40% engagement rate: Strong; visitors are exploring
- 20-40% engagement rate: Average; room for improvement
- <20% engagement rate: Weak; messaging, speed, or targeting issue
The tactical play: If your engagement rate on high-intent pages (pricing, demos, comparisons) drops below 25%, your page copy isn't compelling, or your page speed is killing engagement before content loads.
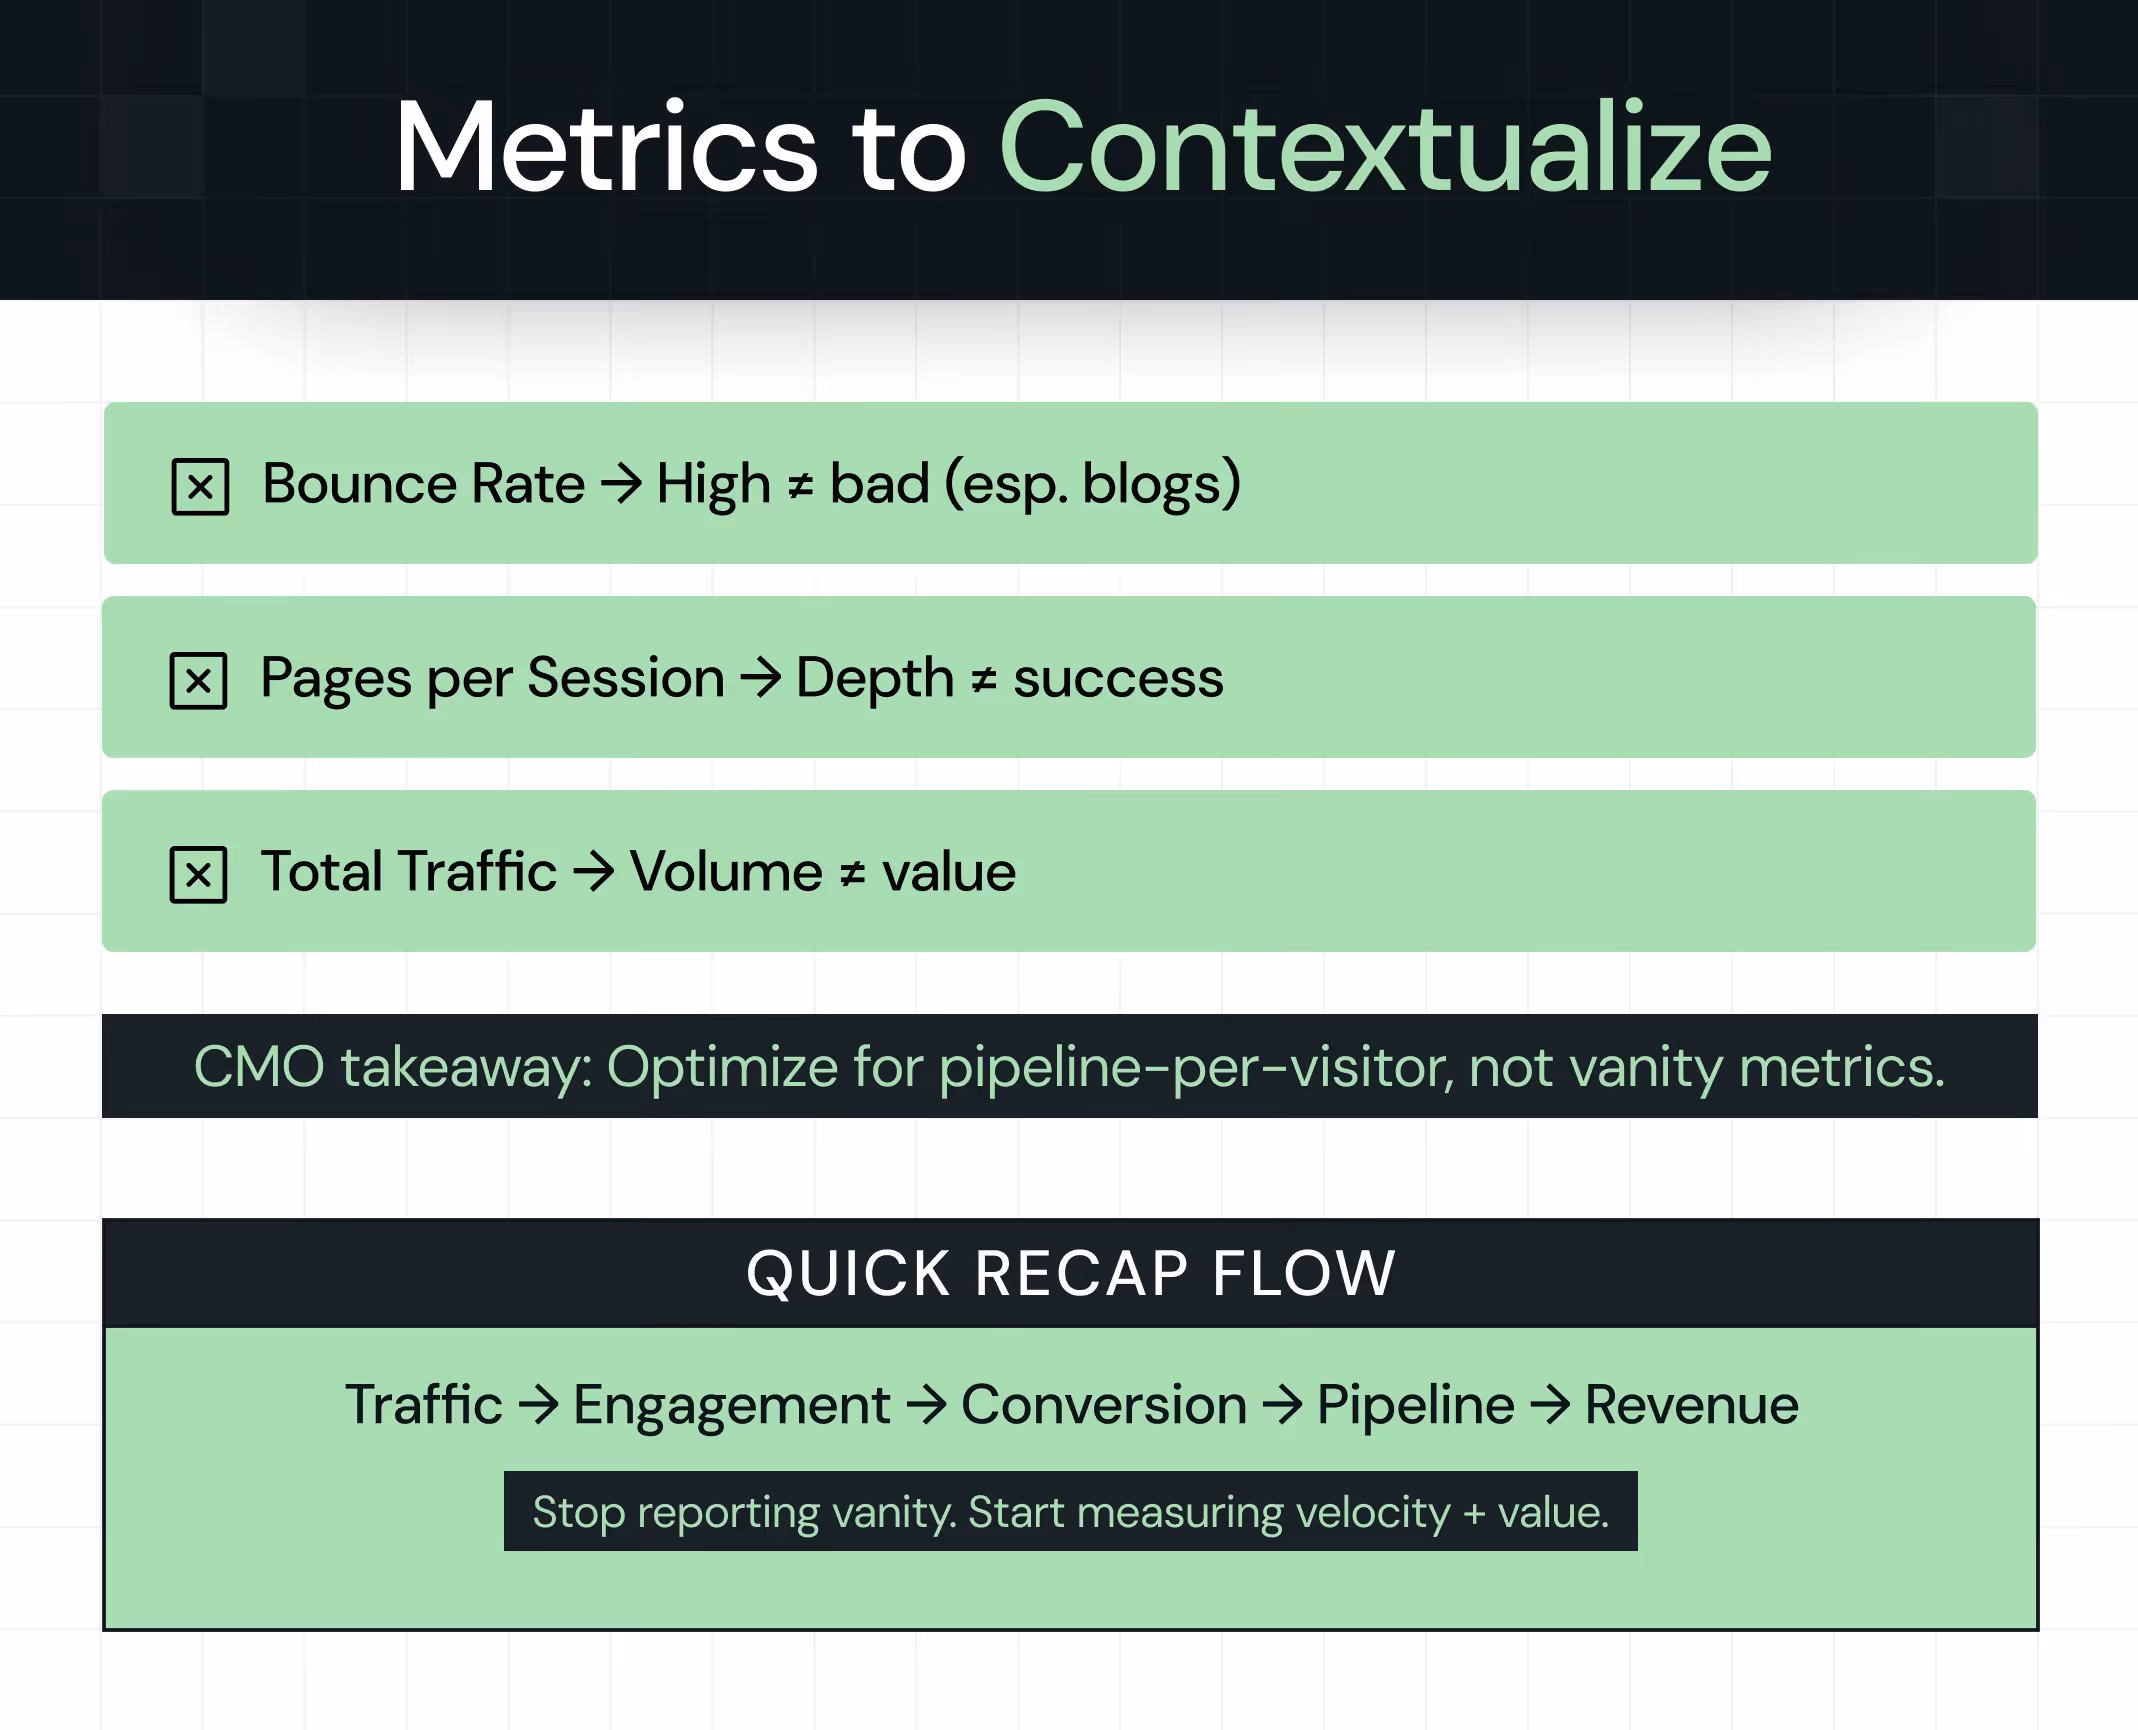
Which Website KPIs to Avoid (And Why Marketers Get Them Wrong)
Not all B2B website KPIs deserve your attention. Here are the metrics that commonly distract CMOs from the metrics that matter:
1. Bounce Rate
The myth: "High bounce rate = bad website."
The reality: B2B educational content often has bounce rates of 60-90%, which is perfectly healthy. If a visitor lands on a blog post answering their specific question and bounces after 2 minutes, they got what they needed. That's success, not failure.
Bounce rate is only a concern on commercial pages (pricing, product pages, CTAs) where the expectation is that visitors will explore further.
When to ignore it: On blog content, guides, and educational resources. Expect high bounce.
When to care: On pricing pages (>70% bounce = messaging problem) and product overview pages (>60% bounce = clarity issue).
2. Pages Per Session
The myth: "More pages viewed = better engagement."
The reality: A visitor who finds everything they need on one page and converts is vastly more valuable than a visitor clicking through five pages and bouncing.
What matters is task completion, not page volume. If your product page is comprehensive enough that visitors don't need to explore further and they sign up for a demo, that's a win, not a failure.
When to measure it: Only as a diagnostic tool. If pages per session drop significantly, it could indicate that your site structure has changed or navigation has broken. But increasing pages per session as a goal is counterproductive.
3. Total Website Traffic
The myth: "More traffic = more customers."
The reality: 100,000 unqualified visitors generating one customer is worse than 10,000 high-intent visitors generating five customers.
Traffic without conversion context is just noise. A CMO who doubled traffic but halved conversion rate is actually moving backward, not forward. Yet this happens constantly.
When to measure it: Only in context. "We grew traffic 30% and conversion improved 15%, so pipeline-per-visitor grew 45%." That's a useful statement. "We grew traffic 30%" Standing alone tells you nothing about business impact.
Building Your Website KPI Dashboard: The CMO Framework
Here's exactly how to structure website KPI measurement so you're tracking what matters:
Tier 1: Revenue Impact Metrics (Track Daily/Weekly)
These are your north star metrics. If these move, you own the result.
1. Pipeline Influenced by Website (Target: 30-50% of total pipeline)
- Sub-metric: Website-sourced pipeline vs. website-influenced pipeline
- Update frequency: Weekly
- Tool: HubSpot, Salesforce, Marketo with native attribution, or third-party attribution like 6sense or Ruler Analytics
2. CAC: LTV Ratio (Target: 3:1 to 5:1)
- Sub-metric: CAC by channel (organic, paid, content, events)
- Update frequency: Monthly
- Tool: Tableau, Looker, or custom Salesforce dashboard
3. Lead → Customer Conversion Rate (Target: 2-5%)
- Sub-metric: By traffic source, by product line, by ICP segment
- Update frequency: Weekly
- Tool: Google Analytics + CRM integration
4. Sales Cycle Velocity (Target: Improve 5-10% YoY)
- Sub-metric: Days in each stage, deal aging, time-to-first-conversation
- Update frequency: Weekly
- Tool: Salesforce, Veelo, or custom reporting
Tier 2: Funnel Health Metrics (Track Weekly/Bi-Weekly)
These metrics help you diagnose where friction lives in your funnel.
1. Conversion Rate: Visitor → Lead
- By traffic source, by landing page, by device type
- Update frequency: Weekly
- Tool: Google Analytics 4, CRO platforms like VWO or Unbounce
2. MQL → SQL Conversion Rate
- By lead source, by lead scoring accuracy, by sales team
- Update frequency: Bi-weekly
- Tool: HubSpot, Marketo, or Salesforce
3. SQL → Opportunity Conversion
- By industry, by company size, by deal size
- Update frequency: Weekly
- Tool: Salesforce
Tier 3: Engagement Signals (Track Bi-Weekly/Monthly)
These leading indicators predict downstream conversion changes.
1. Scroll Depth on Key Pages
- Homepage: Target 60%+
- Pricing page: Target 70%+
- Product page: Target 65%+
- Tool: Hotjar, Google Analytics 4 with GTM scroll triggers
2. Return Visitor Rate (Target: 30-50%)
- Tool: Google Analytics 4
3. Average Session Duration (Context-dependent; no universal target)
- Tool: Google Analytics 4
Explore "A Step-by-Step Guide to Optimize a Landing Page for Maximum ROI" – a practical playbook showing the highest-leverage optimizations that move conversion rate metrics.
With ThunderClap, You Can Align Website KPIs with Marketing and Sales
Everything we've covered points to one simple reality: most B2B websites are optimized for vanity, not for revenue. You're tracking traffic and clicks while leaving millions in unrealized pipeline.
At ThunderClap, we've helped 129+ B2B companies change this. We don't build websites that look pretty. We build websites that convert, scale, and compound into measurable revenue impact.
Our approach starts with your KPIs. We ask: What does success actually look like? How much pipeline does this site need to generate? What's the conversion rate required to hit your ARR goals?
Then we work backward, optimizing every element: messaging, design, speed, CTA strategy, against those metrics. The result? Companies are seeing 22% conversion improvements, 50% engagement lifts, and websites that sales teams are actually proud to share.
Book a free 30-minute website strategy session with ThunderClap, and we'll audit your current KPI tracking, identify your biggest revenue gaps, and show you exactly where a strategic website upgrade could help pipeline growth.
{{ctaBlock}}
FAQs
1. How do you measure KPIs for a new website?
For a new site, you measure Website KPIs by setting clean baselines, not by chasing volume. Start with analytics, CRM, and attribution tools that are connected. Then track a small set of B2B Website KPIs: engagement rate, scroll depth, visitor-to-lead conversion, early pipeline influence, and time to first sales conversation. These are the Most Important Website KPIs at launch because they show whether the site attracts the right audience and creates intent. The priority is clarity and consistency in the Website KPIs to Track, not optimization on day one.
2. How do I choose the right KPIs for my website?
You choose the right Website KPIs by working backward from revenue goals. If a metric doesn’t influence pipeline, CAC, or sales velocity, it’s not a priority. Strong B2B Website KPIs include pipeline influenced by the website, CAC:LTV ratio, funnel-stage conversion rates, and sales cycle velocity. These are the Most Important Website KPIs because they guide decisions and signal growth.
3. How often should I measure website KPIs?
You should measure Website KPIs based on how directly they affect revenue. Track revenue and conversion-focused B2B Website KPIs weekly, including pipeline influence, lead-to-customer conversion, and sales velocity. Review CAC and CAC:LTV monthly, since they trend over time. Monitor engagement metrics bi-weekly or monthly. The Most Important Website KPIs need frequent review, while supporting signals provide context.
4. How can I improve poor-performing KPIs?
Weak pipeline influence signals misaligned content or poor ICP targeting. High CAC indicates inefficient conversion, not a traffic problem. Slow sales velocity often stems from weak intent signals or slow page performance. The Most Important Website KPIs improve when you test one variable at a time and measure impact. Treat your Website KPIs as a diagnostic system, not a report card.


.webp)
Browse Similar Articles
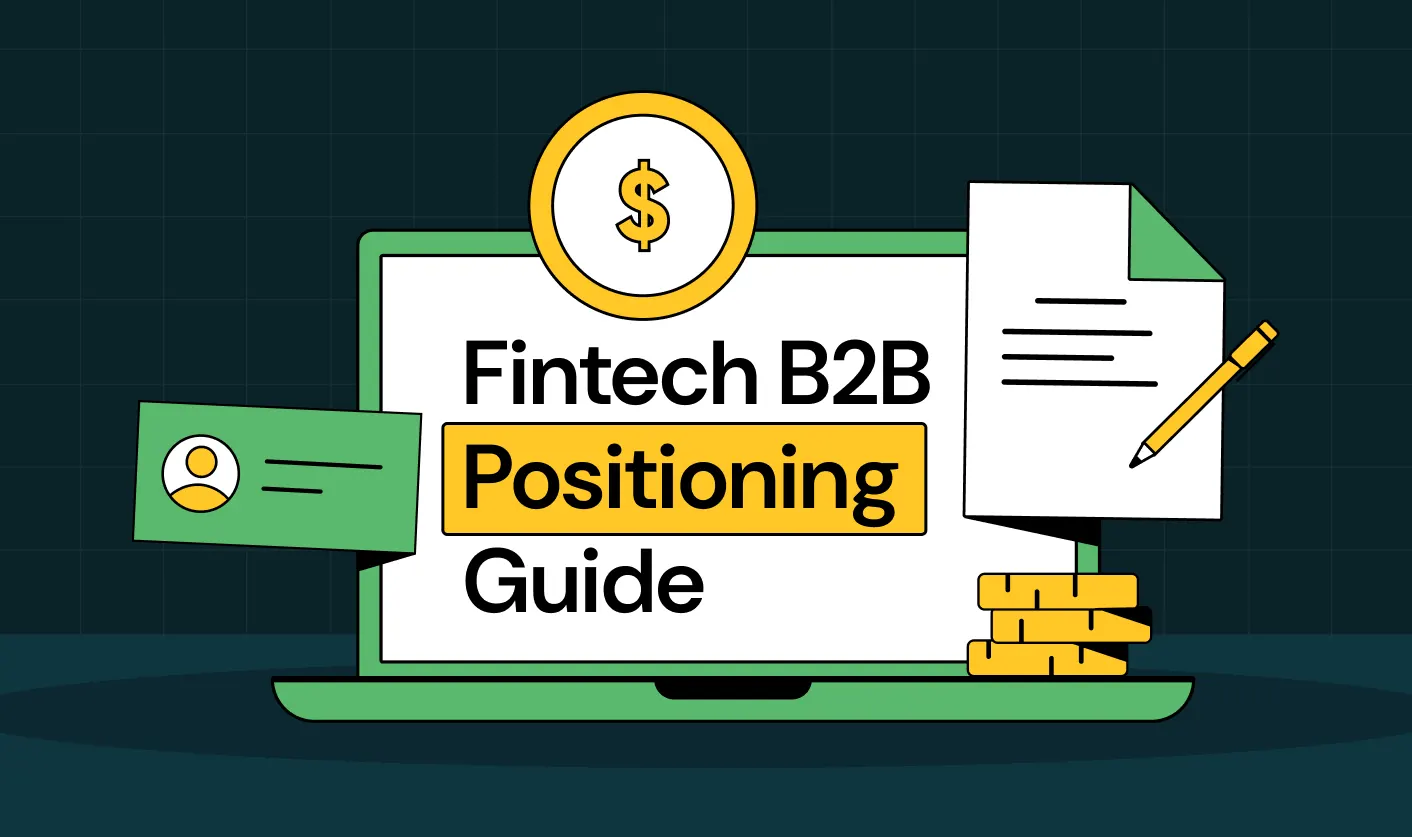
The Ultimate Fintech B2B Positioning Guide for 2026 (That Actually Drives Conversions)

.svg)
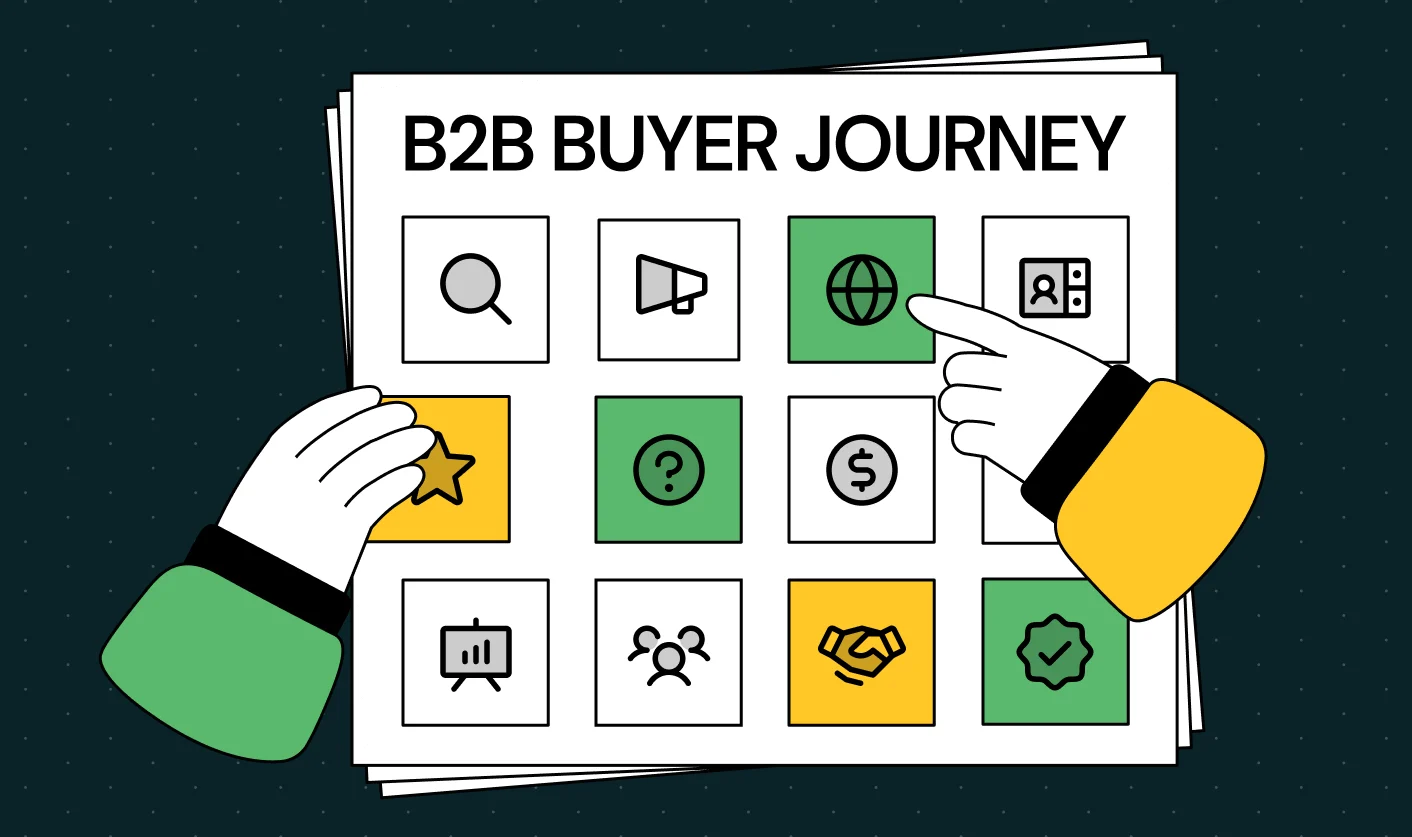
Mapping the B2B Buyer Journey to Improve Conversions Across Every Touchpoint
.webp)
7 Best Website Maintenance Companies in India for Growth-Led B2B Teams (2026)

.webp)
8 Best Healthcare Website Design Agencies for HIPAA-Compliant Sites in 2026


How to Find the Best Web Design Company in Houston, Texas for B2B Brands (6 Best Picks)
Positioning That Wins: How to Make Complex B2B Products Clear and Compelling

The Step-by-Step Website Redesign Process B2B Teams Use to Increase Conversions (Without Killing SEO and Pipeline)
7 Best Video Production Agencies for SaaS Product Walkthroughs and Feature Videos


How to Choose the Best B2B Website Maintenance Company: 9 Questions to Ask Before You Hire One


How to Choose a Web Design Company in San Francisco in 2026 (with Examples)

10 Best Web Design Companies in Florida in 2026 and How to Choose the Right One

How to Use Brand Storytelling on Your Website to Close More B2B Deals and Build Buyer Trust

SaaS CRO Best Practices: What High-Growth Brands Do Differently to Win Conversions

How a Rebranding Agency Can Redefine Your B2B SaaS Identity and Boost Pipeline

B2B Marketing Trends in 2026 That Directly Influence Pipeline and Revenue

Top 7 Video Marketing Agencies Driving B2B SaaS Brand Awareness in 2026

Why Partnering with a B2B Brand Positioning Agency Accelerates Market Differentiation

The Complete Website Redesign Checklist for B2B SaaS Teams Ready to Scale
.avif)
9 Best Webflow Development Agencies in India for 2026 (In-Depth Review)
10 Product Marketing Companies Powering the Fastest-Growing SaaS Brands in 2026
Website Copywriting Services vs In-House: What's Right for Your Business?

How to Choose a Marketing Agency That Understands B2B SaaS Growth Metrics


How to Choose a Video Marketing Agency That Understands B2B Storytelling

Outsourcing Web Design: Cost-Benefit Analysis for Mid-Market & Enterprise Brands
From Leads to Lifetime Value: How Growth Marketing Agencies Scale SaaS Revenue
Build a B2B Website Strategy That Aligns with Sales and Marketing Goals

Webflow vs WordPress: Which Platform Is Better for Your Business Website in 2026?
Fintech Web Design That Builds Trust: 8 UX Principles Every Fintech Site Needs


Optimizing for Intent: How B2B Website Messaging and UX Changes Help Capture Top-Funnel Buyers


12 Best B2B Web Development Agencies in the US to Build Scalable Websites

From Audit to Action: 8-Step Process to Optimize Your B2B Website Strategy for 2026 Buyers

How to Design a High-Converting Landing Page from Scratch (2026 Edition)

From Click to Customer: Proven Landing Page Conversion Optimization Techniques

How to Write Website Copy That Converts: A Step-by-Step Guide for 2026

How to Optimize a Landing Page for Maximum ROI: A Step-by-Step Breakdown


AI Landing Pages That Convert: 7 Design Principles Every AI Platform Should Follow
From Traffic to Pipeline: B2B Website Growth Strategy for Scaling Teams
B2B Website Optimization Strategy: Speed, UX, SEO, and CRO in One Playbook


Outsourcing Webflow Maintenance vs. In-House Management: Which is Better?


SaaS Website Design That Converts: 7 Must-Have Elements to Win More Signups
Top 7 Webflow Integrations to Supercharge Your Website's Performance and Conversions

Outsourcing Web Development: Cost-Benefit Analysis for Startups & Enterprises


Interested in seeing what we can do for your website?


.webp)
