


10 Top Website Analytics Tools for Measuring User Behaviour

You can redesign a landing page and feel great about it. Or you can redesign a page and prove it moves revenue. Successful SaaS website revamps are the latter: you diagnose friction with replays, quantify impact with event-driven analytics, and validate fixes with experiments.
The right website analytics stack provides you with the visibility (and proof) that your website revamp was successful.
In this guide, I’ll walk you through the 10 best website analytics tools that SaaS teams like yours can use right now. We will also discuss what each tool does best, new 2025 features, micro plays for each tool, and the right tech stack based on your needs.
How SaaS teams should choose website analytics tools (quick framework)
Despite the hype, the reality is that no single tool will give you the full picture. Which means the smarter move is to stack tools by layer, not try to force one tool to do it all.
At ThunderClap, we think of analytics as three complementary functional layers that need to work together:
- Numbers (quantitative): Tools in this layer capture hard data on traffic, funnels, retention, and activation. They give you the what at scale.
- Behavior (qualitative): These reveal how users actually interact with pages through replays, heatmaps, and feedback. They explain the why behind drop-offs or confusion.
- Experiments (validation): This layer lets you test and validate changes with real users before committing fully. It ensures design and messaging choices lead to measurable impact.
When choosing their website analytics stack, we advise our clients to align by Stage × Function × Integration need:
- Startup (0–$5M ARR): Keep it lean with a baseline quantitative tracker, one behavioral tool, and lightweight user feedback.
- Scale-up ($5M–$50M ARR): Add deeper product analytics, automated event capture, and controlled experimentation for CRO.
- Enterprise ($50M+ ARR): Expand to advanced analytics stacks with strong governance, server-side testing, and privacy-first hosting (especially for EU compliance).
At ThunderClaps, this is how we run every revamp audit: start with baseline tracking, map ICP journeys through both numbers and behavior, and then design experiments that prove uplift before rolling changes live. It’s this data-first, validation-driven approach that helps us consistently deliver measurable conversion lifts for our clients.
Top website analytics tools in 2025: Side-by-side comparison
For the skimmers, here’s the comparison table so you can see how the top website analytics tools stack up before the deep dive.
{{specficBlog}}
The 10 top website analytics tools in 2025 (and how to use them)
Before we jump into the details, here’s how we approached this guide: we looked at what’s new in 2025, how each tool supports a website revamp, and where it delivers the most ROI. Each profile is a quick buyer’s guide plus a practical play you can use right away.
1. Google Analytics 4 (GA4)
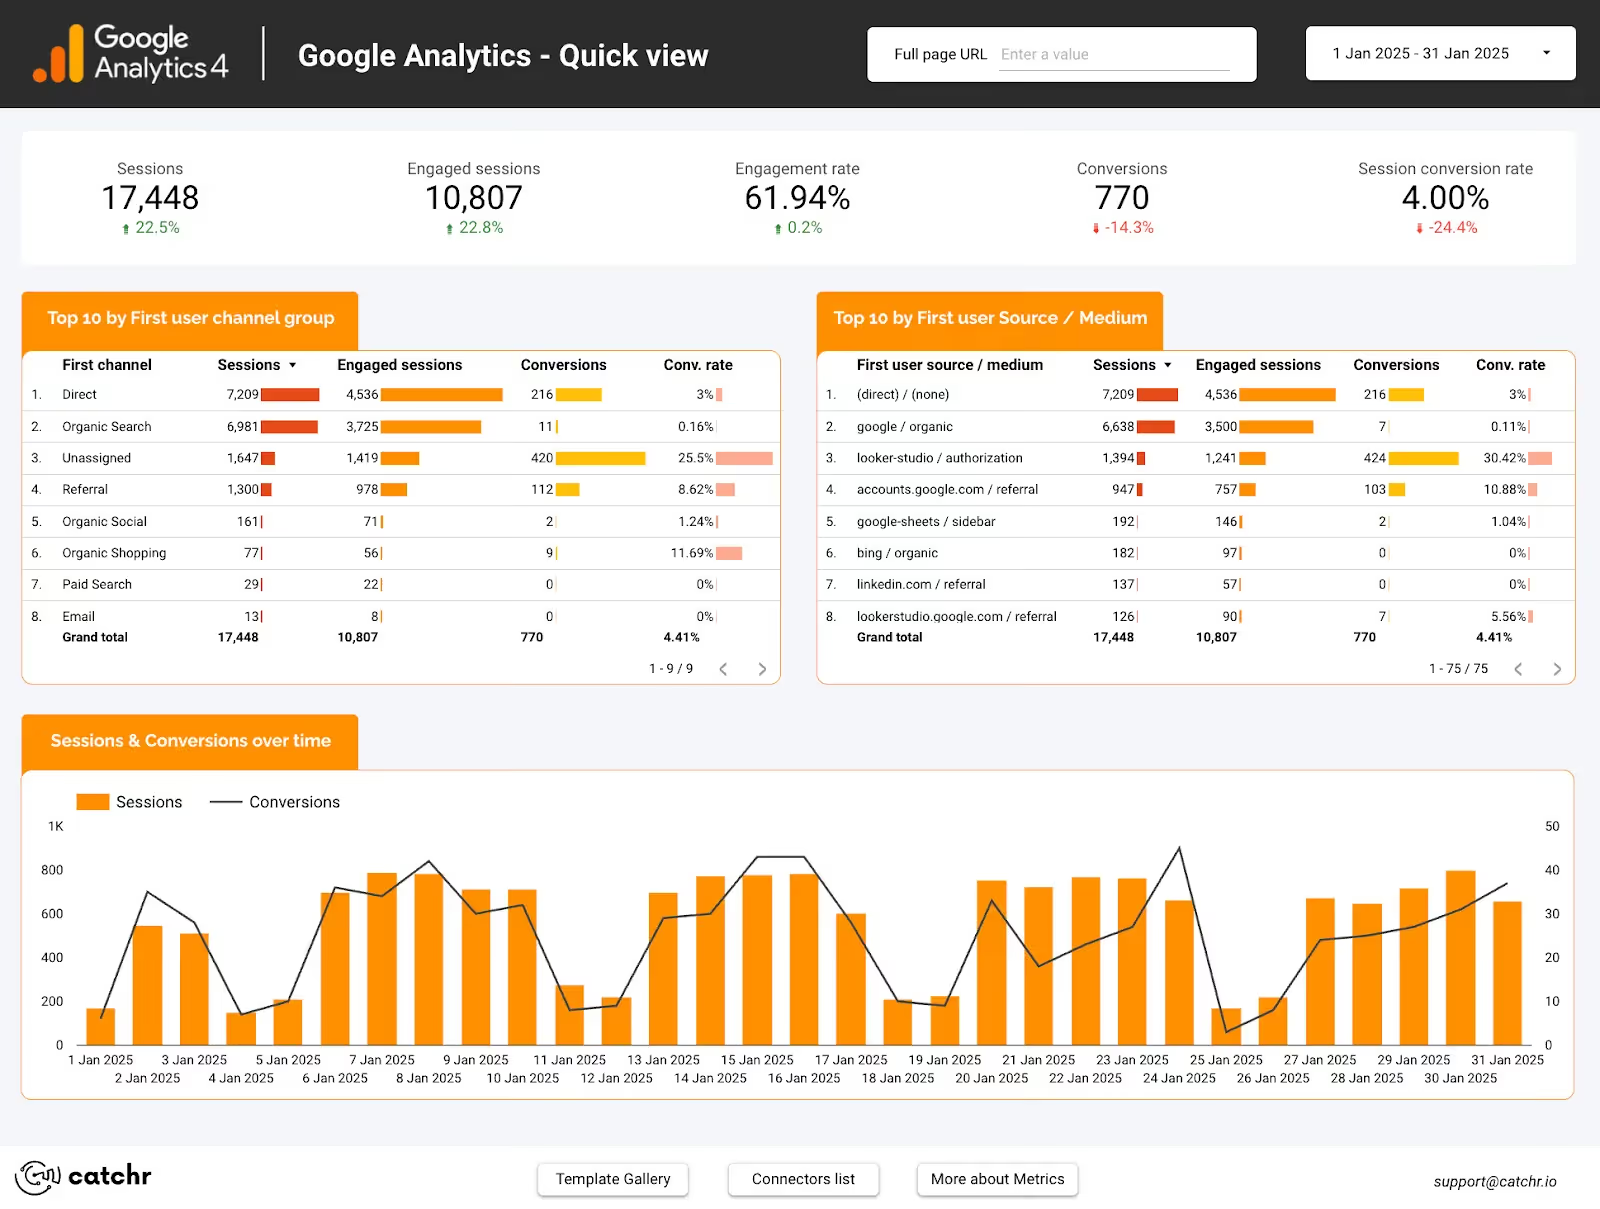
If you’re running a SaaS website in 2025, GA4 is the foundation. It’s not perfect (and yes, it’s more complex than old Universal Analytics), but it gives you the broadest view of acquisition and funnels.
Say you’ve just revamped your pricing page. Traffic looks good, but conversions? Flat. With GA4, you pull a funnel: pricing_view → trial_start → trial_activate. You see, the drop is at trial activation, not pricing. Your problem isn’t design (it’s onboarding).
What’s new in Google Analytics 4 (GA4) in 2025?
This year, GA4 added features that actually make life easier: report annotations, scheduled dashboards sent straight to your inbox, Consent Mode V2 for privacy compliance, and extra ad-cost imports (e.g., Reddit Ads).
Our favorite is “Time to First Action”, a metric that shows how quickly signups actually start using your product.
GA4 Best-fit ICP: Mid-market and enterprise SaaS with event tracking maturity
Google Analytics 4 (GA4) pricing
- Free plan: covers most SaaS teams up to ~100M events/year
- GA360 plan: enterprise-grade, custom pricing; useful above $50M ARR for SLAs and cross-org rollout
Google Analytics 4 (GA4) Pros
- Deep integration with the Google stack
- Strong ML/predictive features
- Direct BigQuery export for custom modeling
Google Analytics 4 (GA4) Cons
- Steeper learning curve than UA
- Requires disciplined event taxonomy and engineering support for clean data
2. Google Search Console (GSC)
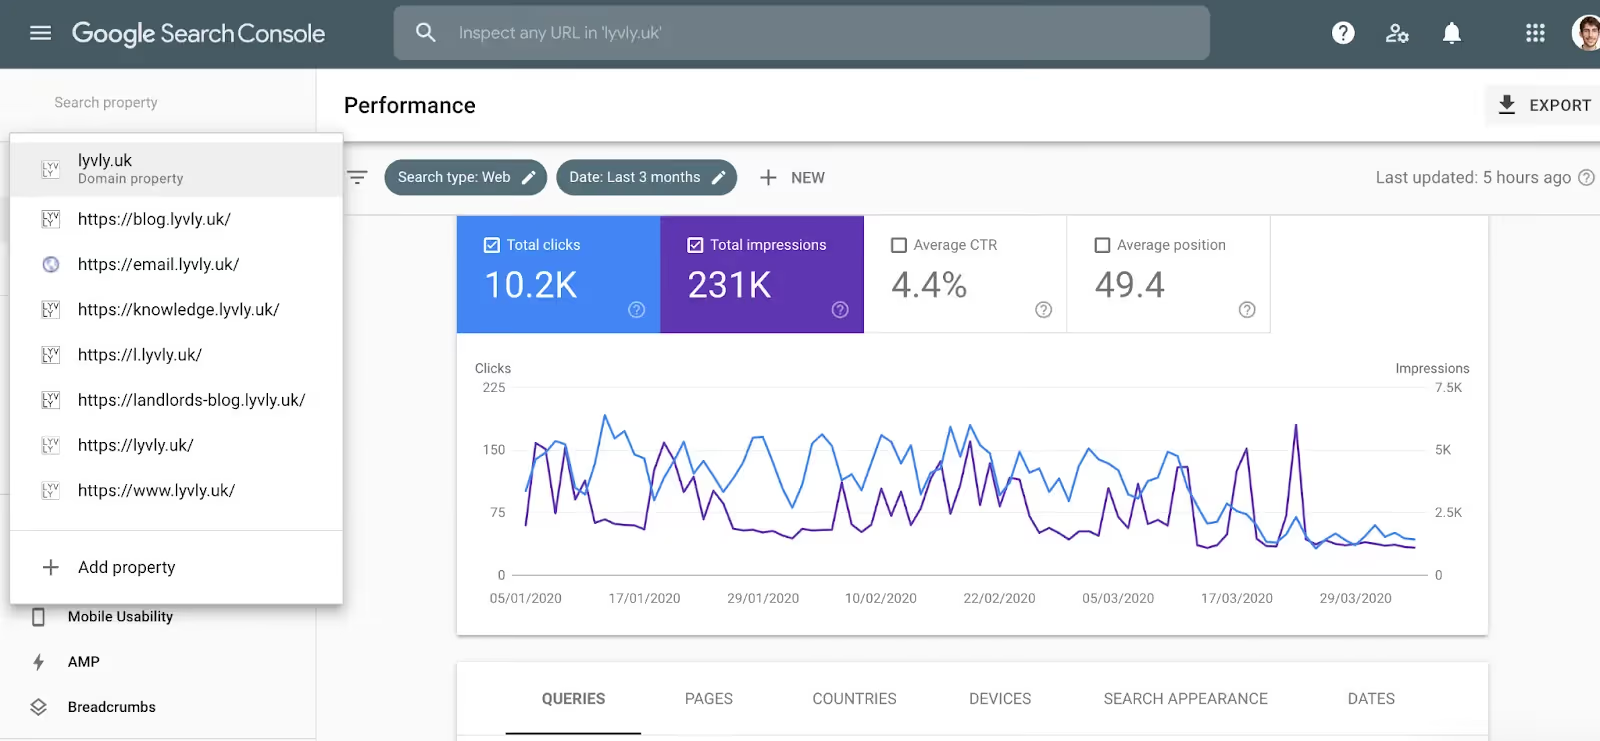
GSC is Google’s free SEO analytics tool that helps SaaS teams decide which pages deserve a facelift. It shows key metrics like impressions, clicks, CTR, and average position (so you know what’s visible but underperforming). For example, if “best project management SaaS” gets 10k impressions but only a 3% CTR, the page is ranking but not attracting clicks.
That’s a clear signal it’s a revamp priority (tweak headlines, images, or page content to better match search intent).
What’s new in Google Search Console (GSC) in 2025?
GSC remains the canonical source for search performance. In 2025, the new Insights tab ties search queries directly to engagement metrics. Finally, you can tell if your “#3 keyword ranking” is sending buyers… or bounce-happy tire kickers.
We also love query-level CTRs, impressions, and engaged session metrics. They have improved on visual trend tracking and milestone messaging too.
GSC Best-fit ICP: SaaS startups revamping SEO-driven content funnels
Google Search Console (GSC) pricing
- Always free
Google Search Console (GSC) Pros
- Detailed search query insights
- Tracks index coverage + Core Web Vitals
- Connects queries to engagement signals
Google Search Console (GSC) Cons
- Not a substitute for behavioral analytics; pairs best with GA4
3. Microsoft Clarity
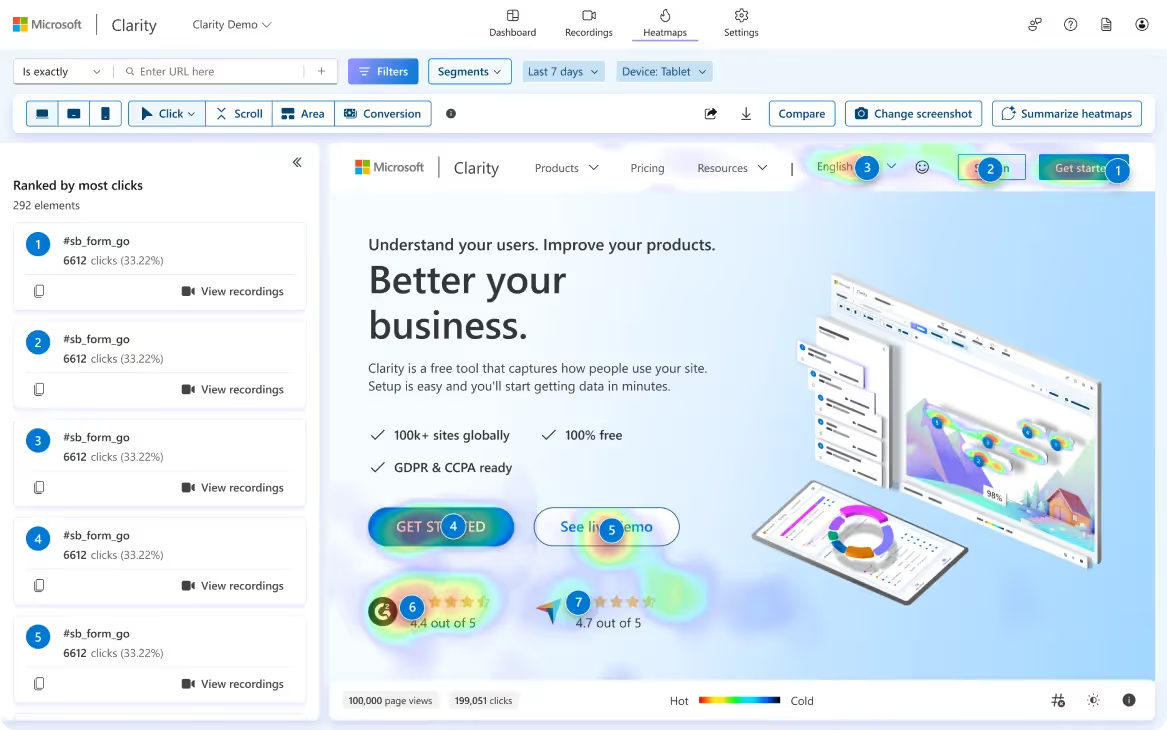
If GA4 tells you what happened, Microsoft Clarity shows you how. This free website analytics tool offers unlimited replays and heatmaps, which are ideal for identifying UX friction during and after a revamp.
Say, during your website revamp, you launch a new signup form. Conversion drops. Instead of guessing, you watch 20 recordings — and notice users rage-clicking the “Next” button. Turns out the form had a hidden error.
And it’s 100% free, with no traffic caps.
What’s new in Microsoft Clarity in 2025?
The 2025 updates are built for teams: AI now groups traffic channels (yes, even AI search traffic), and you can add annotations to session replays. Now, when you launch “new signup flow v2,” your team knows exactly when the change happened. You can also use Copilot to get AI-generated summaries to effortlessly condense hours of session recordings and heatmaps into actionable insights.
Microsoft Clarity Best-fit ICP: Startups and mid-market SaaS needing UX diagnosis at scale
Microsoft Clarity pricing
- Always free (no session caps)
Microsoft Clarity Pros
- Unlimited replays
- Super easy setup
- AI frustration detection
Microsoft Clarity Cons
- Less advanced KPI analytics than paid platforms
- Doesn't capture all user sessions. Sometimes heatmaps don't have the entire screenshot, so you can't make judgments about user behaviour accurately.
4. Hotjar
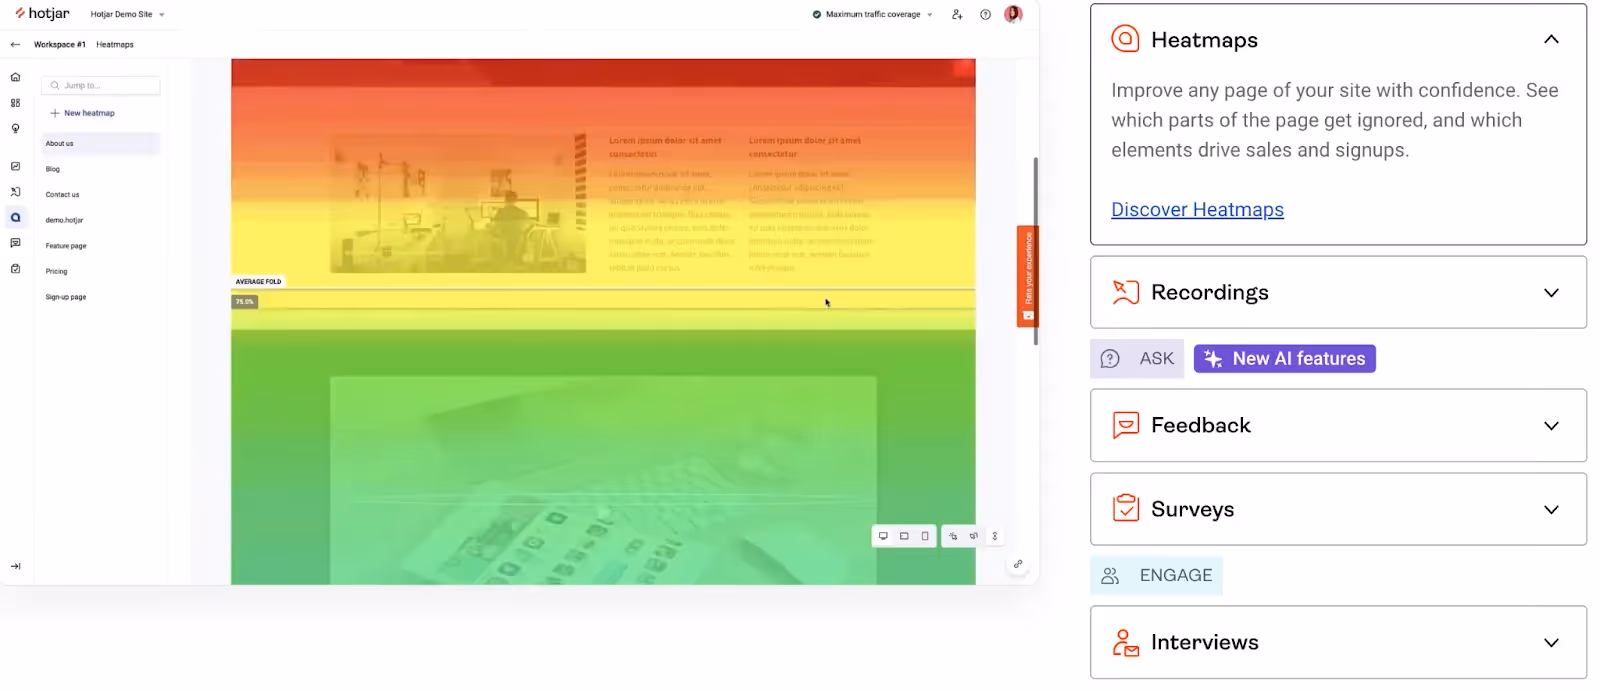
Numbers show what. Replays show how.
Hotjar answers the why. Hotjar blends behavioral analytics with user feedback. It is our go-to for surveys, polls, and heatmaps. We use it religiously for SaaS revamps because it reveals both what happened and why. It is your hack to enable targeted CRO on high-value SaaS pages (pricing, onboarding).
What’s new in Hotjar in 2025?
In 2025, Hotjar goes beyond heatmaps, replays, and polls with AI summaries that cluster user feedback into themes. Translation: you get the top three user blockers without wading through hundreds of survey responses.
We also love their Slack, Jira, HubSpot, and CRM integrations.
Hotjar Best-fit ICP: Growth and UX teams running targeted experiments on pricing, onboarding, and CTAs
Hotjar pricing
- Free plan: track up to 35 daily sessions
- Plus plan (up to 100 daily sessions): $39/month
- Business plan (up to 500 daily sessions): $99/month
- Scale plan (above 500 daily sessions): $213/month
Hotjar Pros
- Fast feedback capture
- Built-in polling and heatmaps
- AI summarization helps prioritize
Hotjar Cons
- Recording/response caps on free plans
- Costs rise substantially with traffic
5. VWO
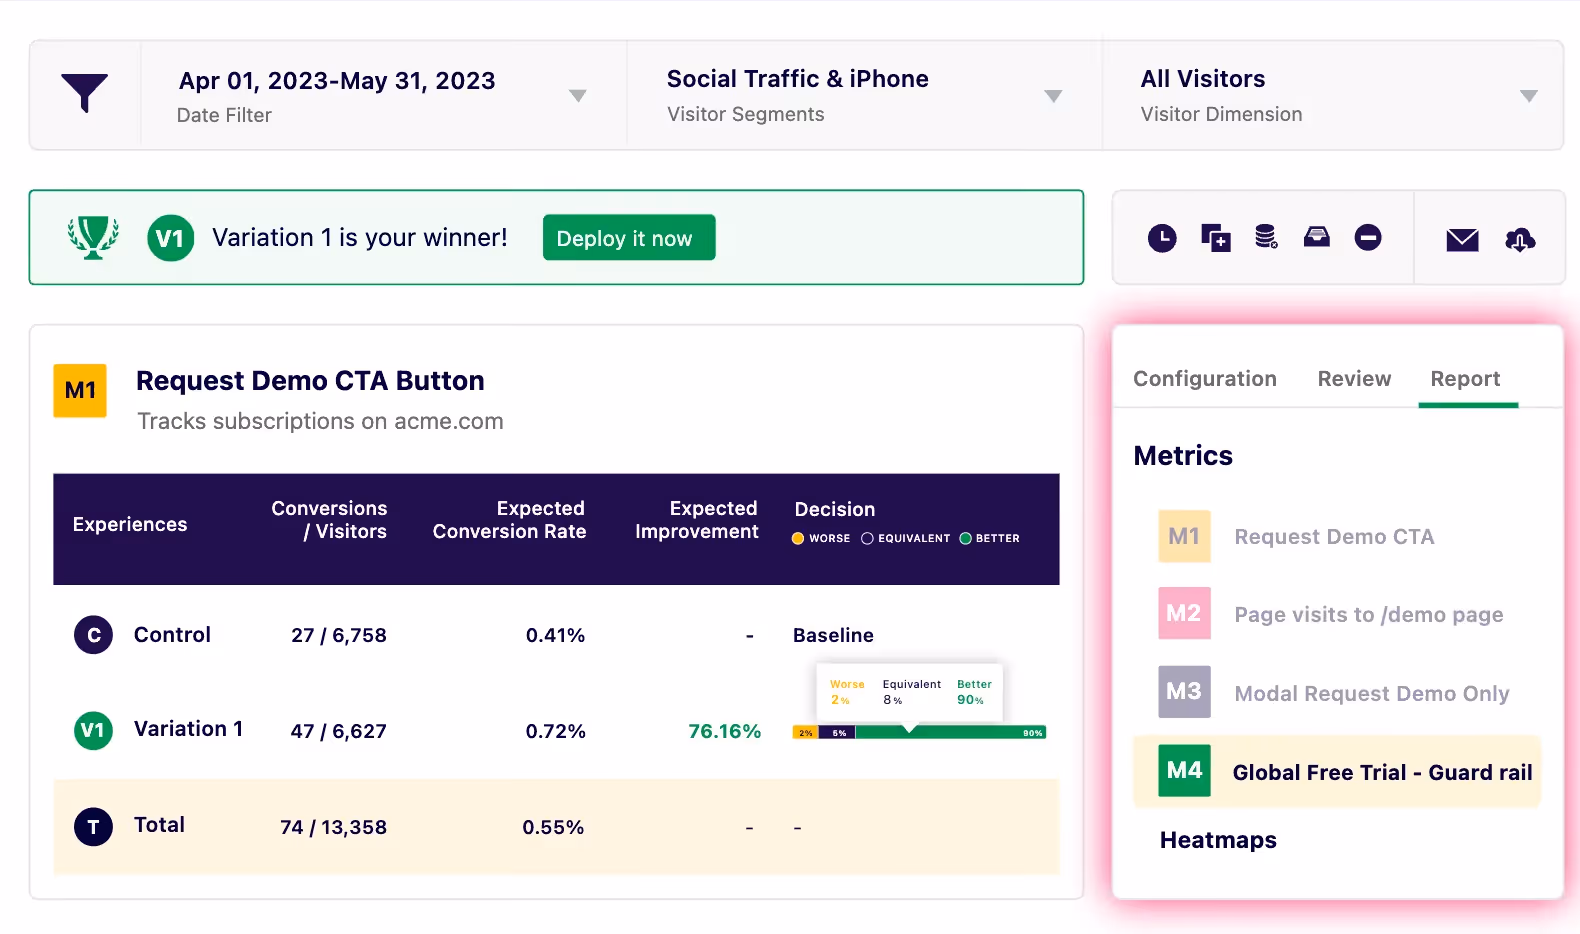
How many times have you launched a redesign, shipped it, and prayed it would perform better? With VWO, you don’t have to pray. You can test before going all in.
VWO is a comprehensive experimentation and conversion rate optimization (CRO) platform. That provides the controlled testing environment needed to validate changes before rolling them out.
The business value is also in improving trial-to-paid funnels with targeted CRO experiments. You can track the ROI of experiments, making growth decisions data-driven.
What’s new in VWO in 2025?
In the 2025 feature rollout, we love the AI-powered VWO Copilot for automated variation creation, as well as time-based and metric-based automation for safer deployments. You will also like its mobile app optimization features, including app funnels and heatmap tap filters.
VWO always had integrations with GA4, Mixpanel, Heap, HubSpot, Salesforce, and Segment. Recent updates also include platforms like Microsoft Clarity and Firebase Crashlytics, and a new, more intuitive campaign creation flow to streamline testing.
VWO Best-fit ICP: Mid-market SaaS scaling CRO
VWO pricing
- Free starter plan with unlimited experimentation
- Also available in Growth, Pro, and Enterprise plans (pricing based on product mix)
VWO Pros
- No-code editor
- AI-driven optimization ideas
- AI for content (generate survey questions and even create different copy variations for A/B testing) & analysis (summarize qualitative feedback)
- ROI tracking
VWO Cons
- Higher-tier features require paid plans
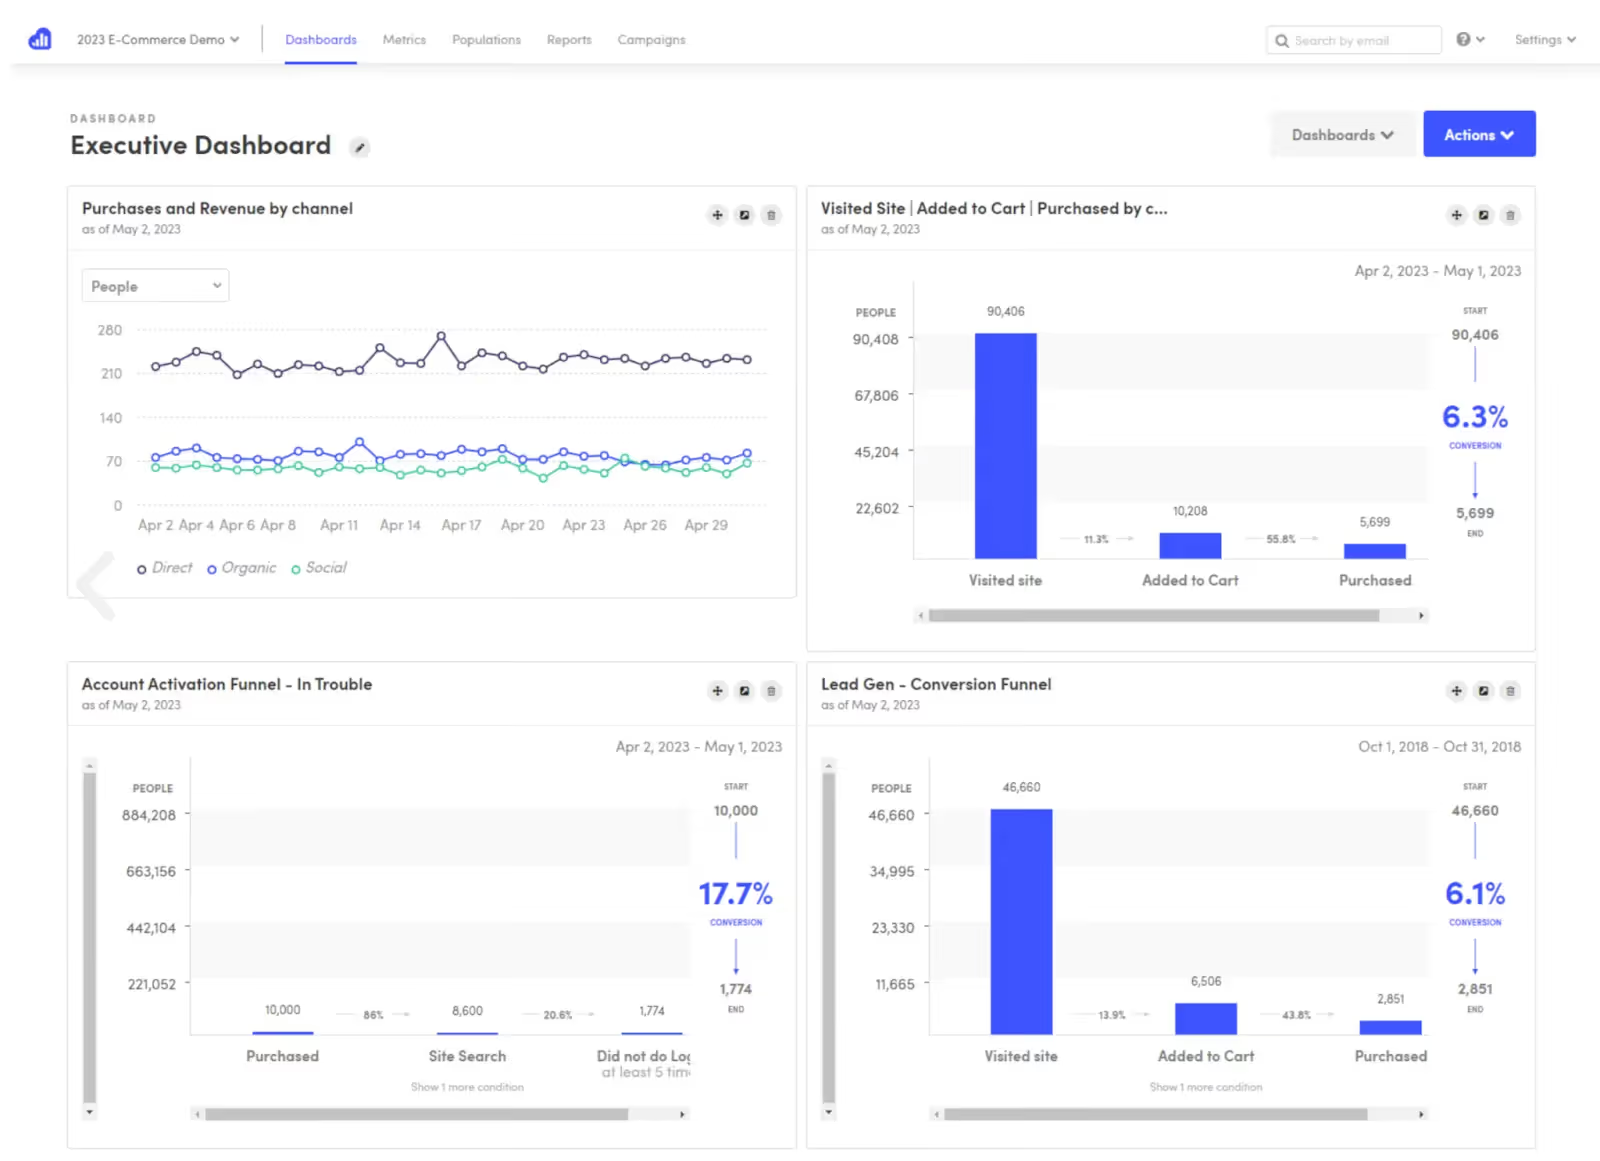
6. Optimizely
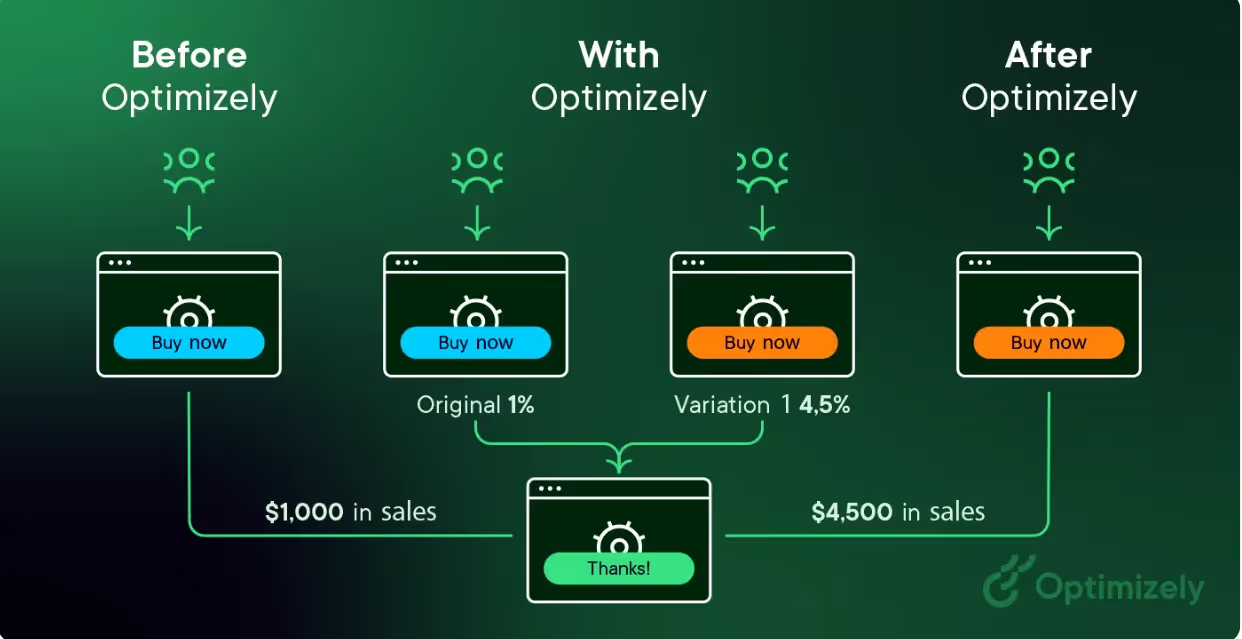
If you’re an enterprise SaaS with engineering muscle, Optimizely is your friend. It is built for engineering-led experimentation. Think feature flags, server-side tests, and ML-powered traffic allocation.
What’s new in Optimizely in 2025?
In 2025, Optimizely is going all-in on AI to make experimentation and marketing workflows faster and smarter. Instead of manually setting up every test or campaign, you can now drag-and-drop AI agents that handle tasks like campaign briefs, keyword research, or experiment plans. The new Opal AI assistant lives inside the platform, helping teams summarize test results or even generate on-brand visuals on the fly. Optimizely’s CMS is also GEO-ready.
Optimizely Best-fit ICP: Large SaaS with engineering teams and complex systems
Optimizely pricing
- Enterprise only; custom pricing based on traffic and scale
Optimizely Pros
- Server-side and client-side experimentation
- ML-powered traffic allocation
- Advanced feature flagging and progressive rollouts
- Personalization based on user segments
- Enterprise-grade integrations
Optimizely Cons
- Costly and complex to implement
- Overkill for small teams.
7. Mixpanel

Mixpanel is perhaps the best website analytics tool at answering: “Do users who try X upgrade more?”
It is a behavioral analytics tool built for SaaS companies, especially those running product-led growth (PLG). Mixpanel excels at cohort analysis and retention. It provides deep insights into activation, retention, and upgrade behaviors.
What’s new in Mixpanel in 2025?
Mixpanel’s 2025 updates are all about making analytics smarter, faster, and easier to act on. With the new AI query tool (MCP), you can literally ask your data questions in plain English and even let other AI tools pull insights directly. On the experimentation side, features like Metric Trees and a reworked Experimentation Reporting help product teams see how engagement ladders up to business goals and ship with more confidence.
Mixpanel also expanded session replays to mobile and added heatmaps for web, bringing qualitative context into the same platform.
Mixpanel best-fit ICP: PLG startups and scale-ups focused on activation and retention
Mixpanel pricing
- Free: up to 1M events/month.
- Growth plan: Usage-based: $0.28 per 1k events beyond free
- Enterprise plan: custom plans for large volumes
Mixpanel Pros
- Deep behavioral analytics, real-time insights
- Powerful, customizable funnels and dashboards
- Identifies individual user journeys
- Generous free plan available
Mixpanel Cons
- Steep learning curve, complex implementation
- Requires manual event tracking
- Limited qualitative user understanding
- Not ideal for marketing attribution
8. Lucky Orange
Lucky Orange is an all-in-one conversion optimization and behavioral website analytics platform. For SaaS teams revamping websites, it’s especially valuable because it blends diagnostics (heatmaps, replays) with engagement tools (chat, polls, surveys). It lets you both understand problems and intervene before users churn.
The business value is faster insights into funnel leaks, improved onboarding flow conversions, and the ability to recover trial users in real time.
What’s new in Lucky Orange in 2025?
The headline update for 2025 is Lucky Orange Discovery, an AI-powered tool launching in summer 2025. Discovery automatically scans your customer journey and highlights specific optimization opportunities (essentially surfacing “where you’re leaking conversions” in plain English). Instead of manually piecing together heatmaps and funnels, you get packaged insights that tell you what needs attention and why.
Lucky Orange Best-fit ICP: SaaS businesses needing combined UX analytics + live engagement.
Lucky Orange pricing
- Free plan (100 sessions/month)
- Build plan: $39/month
- Grow plan: $89/month
- Expand plan: $229/month
- Scale plan: $899/month
- Enterprise plan: Custom
Lucky Orange pros
- Combines analytics + engagement (chat, polls)
- Tight CRM integrations (HubSpot saves time)
- Affordable entry tiers
Lucky Orange cons
- Pricing rises quickly with scale
- The interface can feel busy for new users
9. Matomo
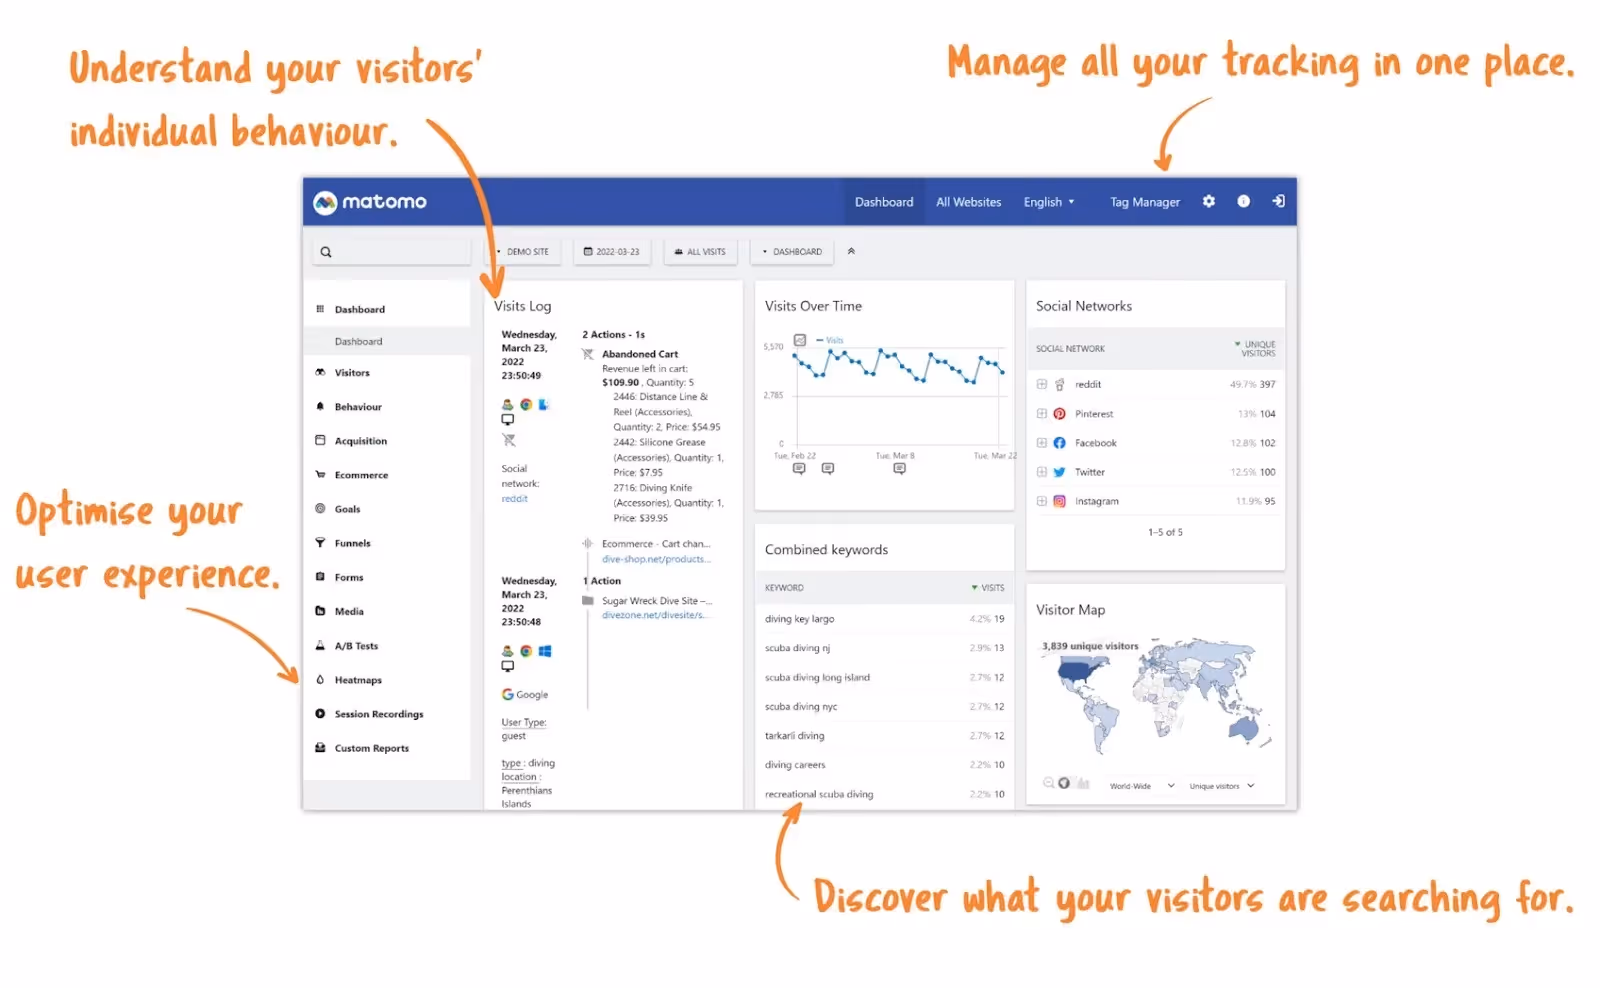
Matomo is a privacy-first website analytics tool that combines all the essentials (funnels, cohorts, goal tracking, heatmaps, and session replays) with enterprise-grade governance. Unlike mainstream analytics tools, it gives you 100% data ownership (whether you host it yourself or use Matomo Cloud), so you always know where data lives and how it’s used.
What’s new in Matomo in 2025?
You can now enforce strong passwords, set custom token expiry, and receive alerts for inactive accounts. You can also monitor multiple sites more easily with the redesigned All Websites dashboard, which adds a cleaner layout and a Total Hits metric for quick traffic checks. And with new Tag Manager variables and smoother usability, you can track behavior more flexibly across your SaaS site.
Matomo Best-fit ICP: SaaS organizations where compliance and user trust are non-negotiable (EU-focused, enterprise, healthcare, finance, gov-tech)
Matomo pricing
- On-premise (self-hosted) plan: Free, open-source (you own the infrastructure)
- Cloud plan: Starts $23/month, scales with traffic volume
- Enterprise plan: Custom (adds SLAs, priority support, and compliance extras)
Matomo Pros
- 100% data ownership (you control where it’s stored)
- Fully GDPR/CCPA compliant, no data sampling
- Import GA4 data directly
- Unlimited websites, users, and segments
Matomo Cons
- UI is less polished than GA4 or Mixpanel
- Self-hosted requires ongoing maintenance
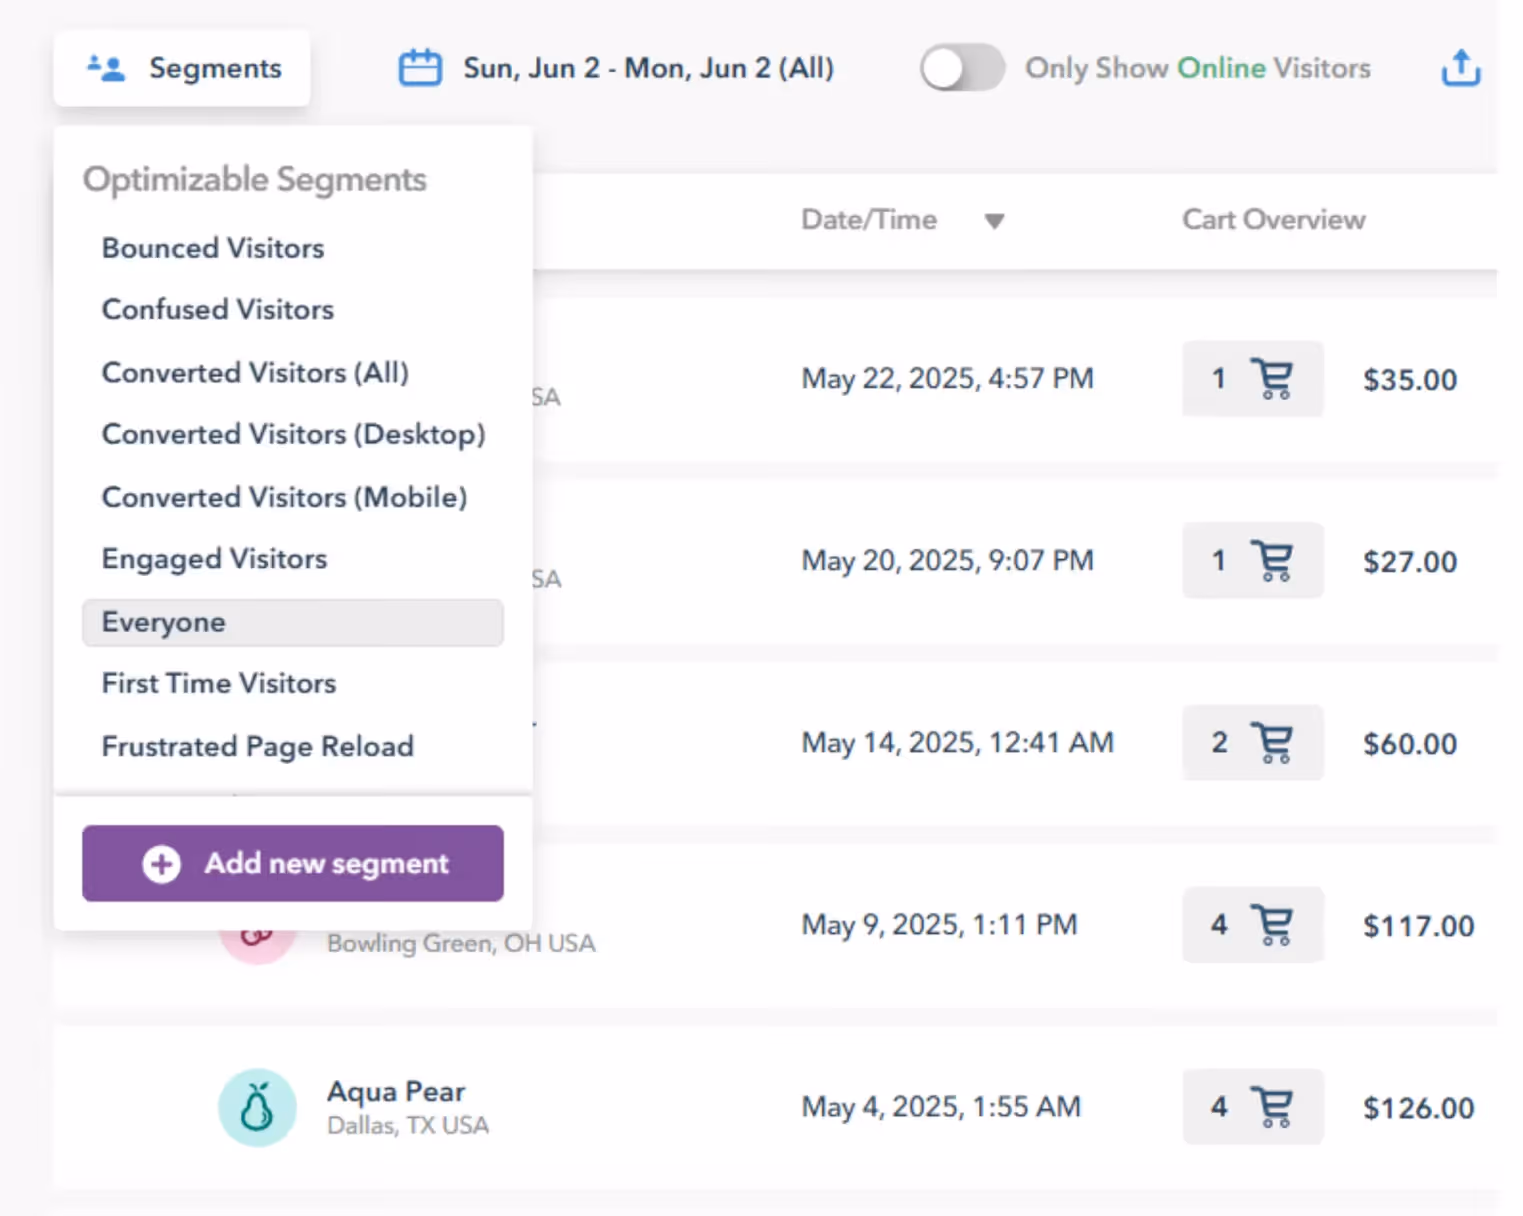
10. Kissmetrics
If GA4 feels built for marketers, Kissmetrics feels built for SaaS. It’s designed specifically for tracking SaaS customer journeys (from first website visit to trial activation, and all the way through retention and upsell). Unlike general web analytics, Kissmetrics gives you people-level tracking. You can follow individual users across sessions and devices, so you don’t just see anonymous pageviews
The business value is better visibility into lifetime value (LTV), churn risk, and the trial-to-paid funnel (the metrics SaaS leaders actually care about).
What’s new in Kissmetrics in 2025?
In 2025, Kissmetrics added tighter CRM and billing integrations, making it easier to link product activity with revenue. You can build more precise cohort and churn reports, and the redesigned funnel reporting makes leaks obvious at a glance. New data pipeline options also let you sync behavioral data directly into warehouses for broader analytics stacks.
Kissmetrics Best-fit ICP: SaaS teams needing revenue-linked behavioral analytics
Kissmetrics pricing
- Bronze plan (up to 10000 monthly events): $25.99/month
- Silver plan (up to 2,000,000 monthly events): $299/month
- Enterprise pricing available for larger SaaS teams.
Kissmetrics Pros
- Strong, responsive customer support
- Excellent for tracking the full customer lifecycle
- Robust analytics with customizable reporting
Kissmetrics Cons
- Setup can be difficult without analytics expertise
- Steeper learning curve for advanced features
Free vs paid website analytics tools: when should you upgrade?
If you’re under $1M ARR, stick with the free stack: GA4, Clarity, GSC. You’ll be shocked at how far it gets you.
You should push to paid website analytics tools when:
- Volume limit: You are at ~50–100k monthly events (free tiers begin to sample or cap retention).
- Analysis needs: You need D90 retention cohorts, raw event exports, or multi-touch attribution.
- Experiment scale: You are running multiple concurrent valid experiments or server-side flags.
Also read: SaaS Website Design That Converts: 7 Must-Have Elements to Win More Signups
Case in point: How ThunderClap revamped ConsultAdd’s website with analytics
ConsultAdd, a fast-growing HR consultancy, partnered with ThunderClap for a website revamp aimed at improving engagement and lead generation. We began with a 3-month analytics and UX audit. The data told a clear story:
- Traffic: ~7.6k visitors in 3 months
- Engagement: homepage average of just 12s
- Conversions: highest from direct traffic, but organic visitors stayed longer
- Forms: “Contact Us” dominated submissions, but CTAs were fragmented across four different touchpoints
- Pages: several sections had fewer than five visits in three months
From these insights, we recommended and implemented key changes:
- Consolidated four contact options into clear, ICP-specific forms
- Rebuilt messaging pillars to speak directly to employers (the primary ICP)
- Redesigned page flows for consistency and purpose, eliminating low-value sections
- Improved homepage trust signals and mobile UX
Here’s a before and after of their home page:
{{specficService}}
The impact: average engagement time rose 500% and form submissions increased by ~60%, giving ConsultAdd a significantly stronger inbound pipeline.
“The most important metric was the 60% increase in conversion. Once we realigned the site around the right ICP and streamlined the experience, analytics insights translated directly into business results.” - Kiran Kulkarni, Partner & Head of Growth at ThunderClap
Turn website analytics into a growth engine with ThunderClap
Using the top website analytics tools isn’t about number crunching and dashboards (it’s about making decisions). The right stack helps you spot where users hesitate, why conversions leak, and how to design pages that speak directly to your ICP.
That’s how we’ve helped brands like Amazon, Razorpay, and Storylane through 129+ B2B website revamps: turning raw data into consistent lifts in engagement and conversions.
Here’s a quick-start checklist for SaaS teams
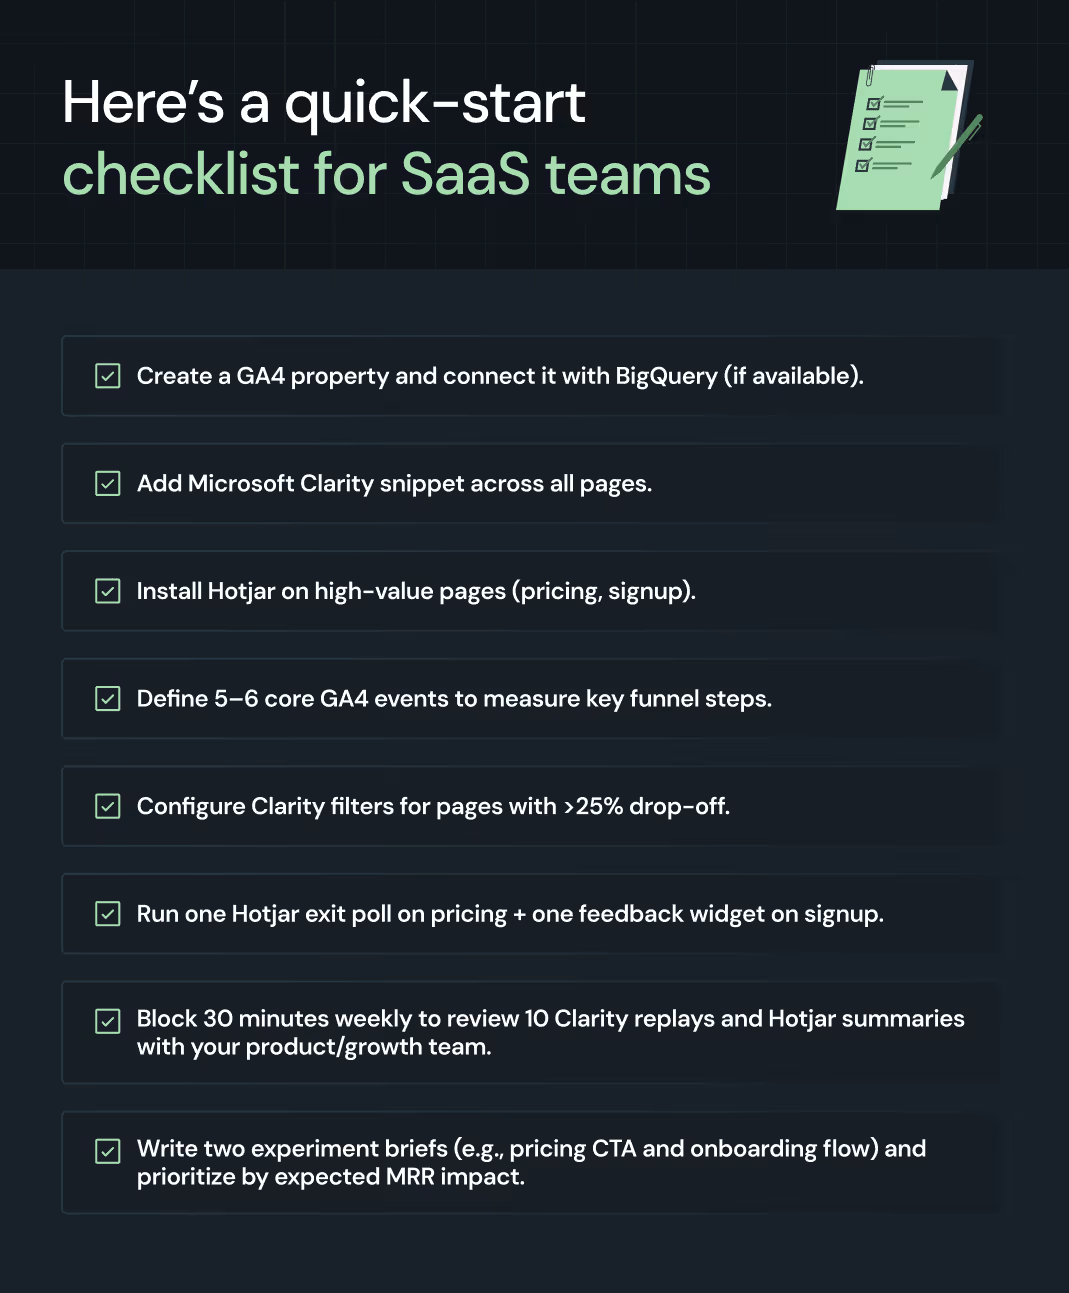
Even this lean stack will uncover friction points, surface ICP-specific insights, and kickstart meaningful experiments. But scaling analytics into a growth engine takes more than DIY. That’s where ThunderClap comes in. We bring the frameworks, CRO playbooks, and design + dev execution to translate analytics into measurable revenue outcomes.
Book a 30-minute consultation with us. We’ll map your current setup, pinpoint funnel leaks, and design a 90-day roadmap that shows exactly how to fix them.
FAQs
1. What are website analytics tools?
Website analytics tools are platforms that track and analyze how users interact with your site — from traffic sources and page views to funnels, heatmaps, and conversions. The top website analytics tools go beyond vanity metrics, giving SaaS teams insights into user behavior, ICP journeys, and where conversion leaks happen.
2. How do website analytics tools help improve conversion rates?
The best website analytics tools show you exactly where users drop off and why. For example, heatmap tools reveal where visitors get stuck, while product analytics platforms highlight which actions lead to upgrades. By combining quantitative tracking (GA4, Mixpanel) with qualitative insights (Hotjar, Clarity), SaaS teams can run targeted experiments, remove friction, and improve trial-to-paid funnels.
3. What features should you look for in a website analytics tool?
When choosing the top website analytics tools, look for three layers of functionality:
- Quantitative tracking → funnels, retention, event-based data (GA4, Mixpanel).
- Behavioral insights → replays, heatmaps, surveys (Hotjar, Microsoft Clarity).
- Experimentation features → A/B testing, personalization, ROI tracking (VWO, Optimizely).
- Other must-haves include integrations with your stack (CRMs, data warehouses, ad platforms), and privacy compliance.
4. What types of SaaS website analytics tools are available?
There are multiple types of SaaS website analytics tools, including:
- Product analytics (e.g., Mixpanel, Heap) to track feature usage and retention.
- User behavior analytics (e.g., Hotjar, Microsoft Clarity) for heatmaps and session replays.
- Web analytics (e.g., Google Analytics 4) for traffic and acquisition insights.
- Financial and revenue analytics (e.g., ProfitWell) for subscription metrics.
- Customer journey and engagement tools that combine data from multiple sources.
5. When should I upgrade from free to paid website analytics tools?
Typically, SaaS companies move from free to paid analytics plans when their data volume exceeds session/event limits of free tiers (often 50K-100K monthly events), or when they require advanced features like cohort analysis, retention tracking, real-time insights, deeply integrated marketing analytics, and regulatory compliance support.
6. How to ensure privacy compliance with website analytics tools?
SaaS companies adopt privacy-first analytics tools, implementing features like cookie consent banners, anonymized IP tracking, minimal PII collection, and GDPR/CCPA-compliant consent modes. Vendor management includes reviewing Data Processing Agreements (DPAs) and data residency options to meet evolving global privacy laws.
7. What are the best practices for integrating SaaS analytics tools?
Best practices include using data pipelines for raw data export (like GA4 to BigQuery), integrating customer data platforms (CDPs) such as Segment with product analytics tools (Mixpanel), combining behavioral tools (Clarity + Hotjar) for UX insights, and maintaining data governance with version control, incremental updates, and automated error monitoring to ensure data quality and timeliness.
8. What is the best free website analytics tool in 2025?
If you’re just starting out, Google Analytics 4 (GA4) and Microsoft Clarity together cover most needs. GA4 gives you quantitative funnels, while Clarity shows you unlimited session replays. For SEO insights, add Google Search Console (GSC). That free trio is enough to run a serious SaaS revamp under $1M ARR.


.webp)
Browse Similar Articles
The Ultimate Fintech B2B Positioning Guide for 2026 (That Actually Drives Conversions)

.svg)
Mapping the B2B Buyer Journey to Improve Conversions Across Every Touchpoint
.webp)
7 Best Website Maintenance Companies in India for Growth-Led B2B Teams (2026)

.webp)

8 Best Healthcare Website Design Agencies for HIPAA-Compliant Sites in 2026


How to Find the Best Web Design Company in Houston, Texas for B2B Brands (6 Best Picks)
Positioning That Wins: How to Make Complex B2B Products Clear and Compelling

The Step-by-Step Website Redesign Process B2B Teams Use to Increase Conversions (Without Killing SEO and Pipeline)

7 Best Video Production Agencies for SaaS Product Walkthroughs and Feature Videos


How to Choose the Best B2B Website Maintenance Company: 9 Questions to Ask Before You Hire One


How to Choose a Web Design Company in San Francisco in 2026 (with Examples)


10 Best Web Design Companies in Florida in 2026 and How to Choose the Right One

How to Use Brand Storytelling on Your Website to Close More B2B Deals and Build Buyer Trust

SaaS CRO Best Practices: What High-Growth Brands Do Differently to Win Conversions


How a Rebranding Agency Can Redefine Your B2B SaaS Identity and Boost Pipeline

B2B Marketing Trends in 2026 That Directly Influence Pipeline and Revenue

Top 7 Video Marketing Agencies Driving B2B SaaS Brand Awareness in 2026

Why Partnering with a B2B Brand Positioning Agency Accelerates Market Differentiation

The Complete Website Redesign Checklist for B2B SaaS Teams Ready to Scale
.avif)
9 Best Webflow Development Agencies in India for 2026 (In-Depth Review)

10 Product Marketing Companies Powering the Fastest-Growing SaaS Brands in 2026
Website Copywriting Services vs In-House: What's Right for Your Business?

How to Choose a Marketing Agency That Understands B2B SaaS Growth Metrics


How to Choose a Video Marketing Agency That Understands B2B Storytelling

Outsourcing Web Design: Cost-Benefit Analysis for Mid-Market & Enterprise Brands

From Leads to Lifetime Value: How Growth Marketing Agencies Scale SaaS Revenue
Build a B2B Website Strategy That Aligns with Sales and Marketing Goals

Webflow vs WordPress: Which Platform Is Better for Your Business Website in 2026?
Fintech Web Design That Builds Trust: 8 UX Principles Every Fintech Site Needs


Optimizing for Intent: How B2B Website Messaging and UX Changes Help Capture Top-Funnel Buyers


12 Best B2B Web Development Agencies in the US to Build Scalable Websites

From Audit to Action: 8-Step Process to Optimize Your B2B Website Strategy for 2026 Buyers

How to Design a High-Converting Landing Page from Scratch (2026 Edition)

From Click to Customer: Proven Landing Page Conversion Optimization Techniques

How to Write Website Copy That Converts: A Step-by-Step Guide for 2026

How to Optimize a Landing Page for Maximum ROI: A Step-by-Step Breakdown


AI Landing Pages That Convert: 7 Design Principles Every AI Platform Should Follow
From Traffic to Pipeline: B2B Website Growth Strategy for Scaling Teams


B2B Website Optimization Strategy: Speed, UX, SEO, and CRO in One Playbook


Outsourcing Webflow Maintenance vs. In-House Management: Which is Better?


SaaS Website Design That Converts: 7 Must-Have Elements to Win More Signups
Top 7 Webflow Integrations to Supercharge Your Website's Performance and Conversions

Outsourcing Web Development: Cost-Benefit Analysis for Startups & Enterprises


Interested in seeing what we can do for your website?


.webp)
